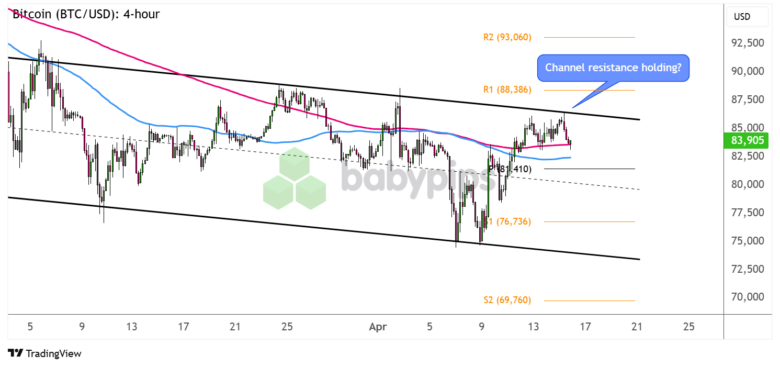
Bitcoin has been cruising lower inside a falling channel that’s been holding since March, and it looks like another bounce off resistance is taking place.
On top of that, a small double top pattern appears to be forming, suggesting that bearish pressure could pick up once the neckline breaks.
Can it go lower from here?
Bitcoin (BTC/USD) 4-hour Chart by TradingView
Bitcoin appears to have flexed its “safe-haven” muscles earlier this month, as “digital gold” trailed the precious metal in raking in gains while global trade tensions flared.
Price has been able to bounce from its descending channel support near the key $75,000 mark all the way back up to the resistance around $85,000-86,000, which is holding as a ceiling so far.
A test of the short-term double top neckline is currently taking place, with a breakdown possibly sending BTC/USD to nearby support levels.
How low can it go?
Remember that directional biases and volatility conditions in market price are typically driven by fundamentals. If you haven’t yet done your homework on bitcoin and the U.S. dollar, then it’s time to check out the economic calendar and stay updated on daily fundamental news!
Near-term support could be found at the pivot point level ($81,410) then the mid-channel area of interest while sustained selling pressure could drag bitcoin back down to the recent lows or the channel support around $72,000-73,000.
Note that the 100 SMA is below the 200 SMA to reflect bearish vibes, although price is still moving above both indicators that could hold as dynamic support near the neckline.
If bullish momentum kicks in and triggers a pop above the channel resistance at $86,000, look out for a possible reversal to the upside targets at R1 ($88,386) then R2 ($93,060).
Whichever bias you end up trading, don’t forget to practice proper risk management and stay aware of top-tier catalysts that could influence overall market sentiment!


