

NEM Elliott Wave technical analysis
This updated Elliott Wave analysis focuses on the Australian Stock Exchange’s NEWMONT CORPORATION – NEM.
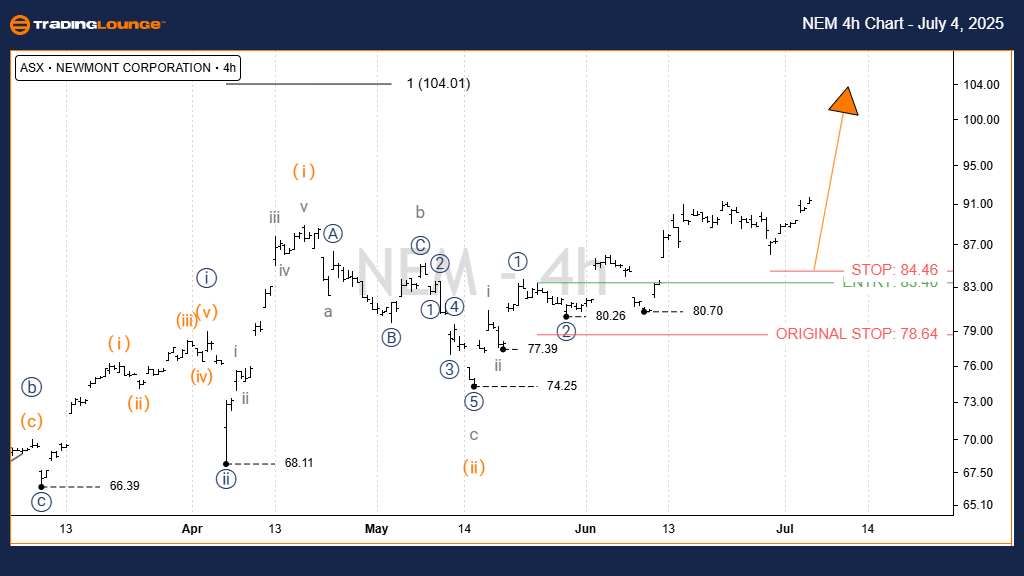
Our current assessment indicates that ASX:NEM is advancing within wave three. The purpose of this report is to provide clear targets and the key invalidation level to help traders identify when the current trend may reverse or continue.
1D chart (Semilog Scale) technical breakdown
-
Function: Major trend (Minor degree, grey).
-
Mode: Motive.
-
Structure: Impulse.
-
Position: Wave iii) – orange of Wave iii)) – navy of Wave 3 – grey.
Key details:
Wave ii) – orange likely completed at the 74.25 low as a zigzag (a, b, c – grey).
From that point, wave iii) – orange has been progressing upward, now targeting the 100.00 level.
Four-hour chart review
-
Function: Major trend (Minor degree, grey).
-
Mode: Motive.
-
Structure: Impulse.
-
Position: Wave iii) – orange of Wave ((iii)) – navy of Wave 3 – grey.
Key details:
The 4-hour analysis confirms the ongoing trend observed in the 1D chart.
Wave iii) – orange continues its upward trajectory, with the main target at 100.00.
In the shorter term, wave iii – grey is also climbing, targeting 90.00.
Conclusion
This technical outlook on ASX: NEWMONT CORPORATION – NEM aims to equip traders with insightful and objective analysis on current market behavior.
By identifying crucial price levels for trend validation or invalidation, we offer a solid framework for interpreting the Elliott Wave count.
Our goal is to support traders with transparent, professional perspectives.