

GBP/USD is under pressure after a sharp daily selloff, weighed down by softer UK inflation data and renewed U.S. dollar strength following a more hawkish Fed tone.
The pair has now dropped back into a familiar support region in the mid-1.3200s, an area that has previously attracted buyers.
But the latest drop raises an important question:
Is downside momentum fading, or are sellers preparing for another leg lower?
The setup is less about calling an immediate bottom and more about watching whether the price can stabilize, reclaim nearby levels, and confirm that demand is returning.
Welcome to “TA Alert of the Day.” Each day after the market close, MarketMilk scans for popular technical indicator alerts. We use these alerts as the basis for a mini-lesson, breaking down what each alert means, why it matters, and how traders might interpret it. The goal is to help beginner traders not only spot these alerts but also understand the logic behind them and how they can inform trading decisions.
What MarketMilk Has Detected
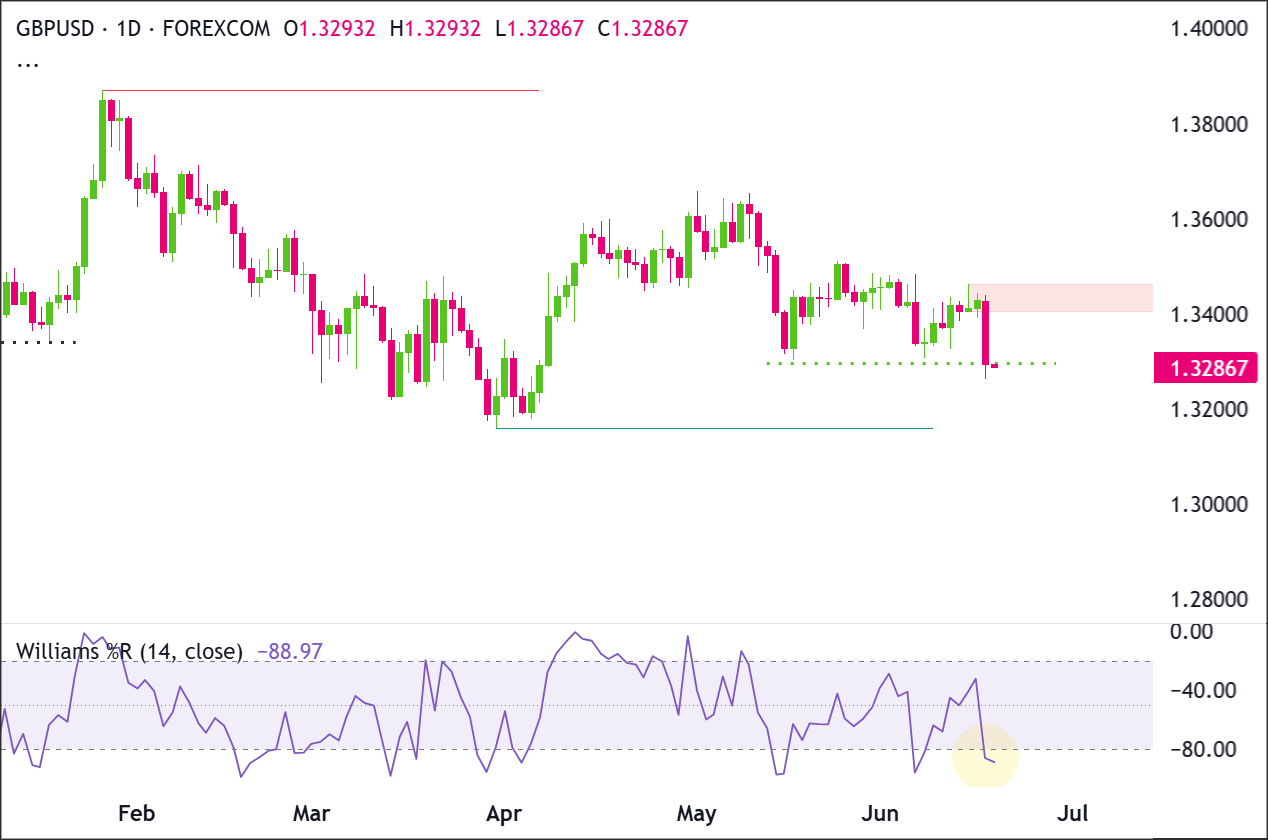
Williams %R (14) on the daily timeframe has moved into oversold momentum, with the indicator dropping to -86.35 and crossing below the -80 threshold.
Price closed at 1.32925 after a large down day that pushed the session low to 1.32620.
Similar oversold clusters appeared around late March and early April, where price was trading in the 1.3180–1.3260 region.
What This Signals
Traditionally, a Williams %R oversold reading suggests that downside momentum has become stretched relative to the last 14 sessions.
In many markets, this condition can attract dip-buying interest or short-covering, particularly if the price is testing a well-watched support area (here, the mid-1.32s to low-1.33s).
If the move is sustained, traders often look for the indicator to recover back above -80 alongside stabilization in daily closes.
However, this same pattern can also represent the early stage of a stronger bearish leg rather than a clean reversal. Williams %R can stay oversold for multiple sessions when a trend accelerates, and what looks like “oversold” may simply reflect persistent selling pressure.
In that failure mode, bounces can be brief and may roll over under nearby resistance (such as 1.342–1.345) where prior consolidation occurred.
The outcome depends heavily on trend context, the quality of the support reaction around 1.326–1.333, and whether momentum improves as price reclaims key prior closes.
Context and confirmation are essential, especially after a large daily candle that can distort oscillator readings for a few sessions.
How It Works
Williams %R is a momentum oscillator that measures where the current close sits relative to the highest high and lowest low over a lookback period (here, 14 days).
It ranges from 0 to -100: readings near 0 imply price is closing near the top of the recent range, while readings near -100 imply closes are near the bottom of the range.
The commonly watched oversold threshold is -80, which highlights oversold momentum (not “cheapness”).
Because it’s range-based, Williams %R is best read as a tool for identifying momentum extremes and potential turning points or pauses, particularly when it aligns with clear support/resistance zones.
Traders often combine it with price action (higher lows, reclaiming levels, or reversal candles) to avoid acting on oscillator extremes alone.
Important: Oversold momentum can persist during strong trends, and the signal becomes more meaningful when it appears at a technically important level (prior lows/support) and is followed by confirmation (e.g., the oscillator rising back above -80 and price holding higher closes).
What to Look For Before Acting
Do not assume an immediate rebound. Consider these factors:
✅ A daily close that holds above the 1.326–1.333 support zone (rather than repeated closes beneath it)
✅ Williams %R turning up and recovering back above -80 (a common “exit oversold” confirmation)
✅ Evidence of demand on the candle (smaller, lower wicks fading, or a clear reversal-style daily candle)
✅ A reclaim of nearby structure, such as 1.342–1.345, which has acted as a frequent pivot area in the past month
✅ Reduced downside follow-through after the large-range selloff day (a sign that selling pressure may be cooling)
✅ Alignment with the 4-Hour or Weekly structure (e.g., higher-timeframe support holding or momentum stabilizing)
✅ Reaction around prior swing areas: resistance near 1.350–1.351 and higher supply near 1.358–1.366
✅ Event risk awareness for GBP/USD (e.g., upcoming central bank communication, inflation/employment releases, or major USD catalysts) that could override technicals
Risk Considerations
⚠️ Williams %R can remain oversold for an extended period in trending selloffs, creating early entries and repeated whipsaws
⚠️ The latest daily candle showed a large range; volatility can expand further and widen stop distances unintentionally
⚠️ A breakdown below the 1.326 area could shift focus toward prior lows in the 1.318–1.320 region from late March
⚠️ Oversold bounces often fail under nearby resistance (notably 1.342–1.345) if the broader structure stays heavy
⚠️ Macro headlines can dominate GBP/USD and invalidate oscillator-based signals quickly
Potential Next Steps
Consider keeping GBP/USD on a watchlist for a confirmed shift in momentum rather than reacting to the oversold reading alone.
Recent candles show rejection from the 1.3400-1.3460 supply area, followed by a sharp bearish push toward 1.3290.
Momentum has weakened, with Williams %R moving back into oversold territory near -87.11, but buyers still need to prove demand by defending 1.3290 and reclaiming 1.3400.
Sellers remain in control unless price stabilizes and closes back above the resistance zone.
Trade Idea: Bullish Continuation Scenario
Setup
The bullish setup depends on GBP/USD holding the current reaction area around 1.3290-1.3300 and then reclaiming the resistance zone at 1.3400-1.3460.
A daily close above 1.3460 would show that buyers have absorbed the recent selling pressure and are attempting to restart the move toward the prior swing area near 1.3600-1.3650.
Entry
Enter long on a daily close above 1.3460, confirming that buyers are breaking out of the recent structure.
Alternatively, enter on a controlled pullback into 1.3290-1.3300 if price stabilizes there and turns back higher.
If price loses that support zone and closes decisively below 1.3290, stand aside and wait for either deeper support to form or a cleaner breakout later.
Stop Loss
For breakout entries: stop on a daily close back below 1.3400. That would invalidate the breakout by showing price could not stay above the former ceiling.
For pullback entries: stop on a daily close below 1.3290. That would invalidate the support-hold idea and show buyers are no longer defending the zone.
Take Profit
Target 1.3600-1.3650, because that is the next clear upside area on the chart and the most natural place for price to retest if the current recovery continues.
Bottom Line
The bullish case improves only if GBP/USD can defend 1.3290-1.3300 and reclaim 1.3400-1.3460. A daily close above 1.3460 would confirm that buyers are regaining control.
If that breakout develops, the next upside target is 1.3600-1.3650. The bullish idea weakens on a daily close below 1.3290, because that would show the recent support area has failed.
Trade Idea: Bearish Pullback Scenario
Setup
The bearish setup is based on GBP/USD failing beneath the 1.3400-1.3460 resistance zone and breaking below the current support area around 1.3290.
If sellers force a daily close below 1.3290, the chart opens room for a deeper pullback toward the major support zone at 1.3160-1.3180.
Entry
Consider entering short on a daily close below 1.3290, confirming that the support zone has failed.
Alternatively, if price pushes into 1.3400-1.3460 and prints a clear bearish rejection candle, enter short on the next daily close back below 1.3400.
If price instead breaks and closes decisively above 1.3460, stand aside, as that would invalidate the bearish pullback idea.
Stop Loss
For breakdown entries: stop on a daily close back above 1.3300. That would invalidate the breakdown by showing price has reclaimed the support zone.
For rejection entries near resistance: stop on a daily close above 1.3460. That would invalidate the bearish idea by confirming buyers have pushed through resistance.
Take Profit
Target 1.3160-1.3180, because that is the next major support area below the current structure and the most likely place where buyers would try to step back in.
Bottom Line
The bearish case remains active while GBP/USD trades below 1.3400-1.3460 and sellers continue to pressure 1.3290. A daily close below 1.3290 would confirm a support failure.
If that breakdown happens, the next downside target is 1.3160-1.3180. The bearish idea is invalidated on a decisive daily close above 1.3460, because that would show buyers have reclaimed the recent resistance zone.
This content is strictly for informational purposes only and does not constitute as investment advice. Trading any financial market involves risk. Please read our Risk Disclosure to make sure you understand the risks involved.