


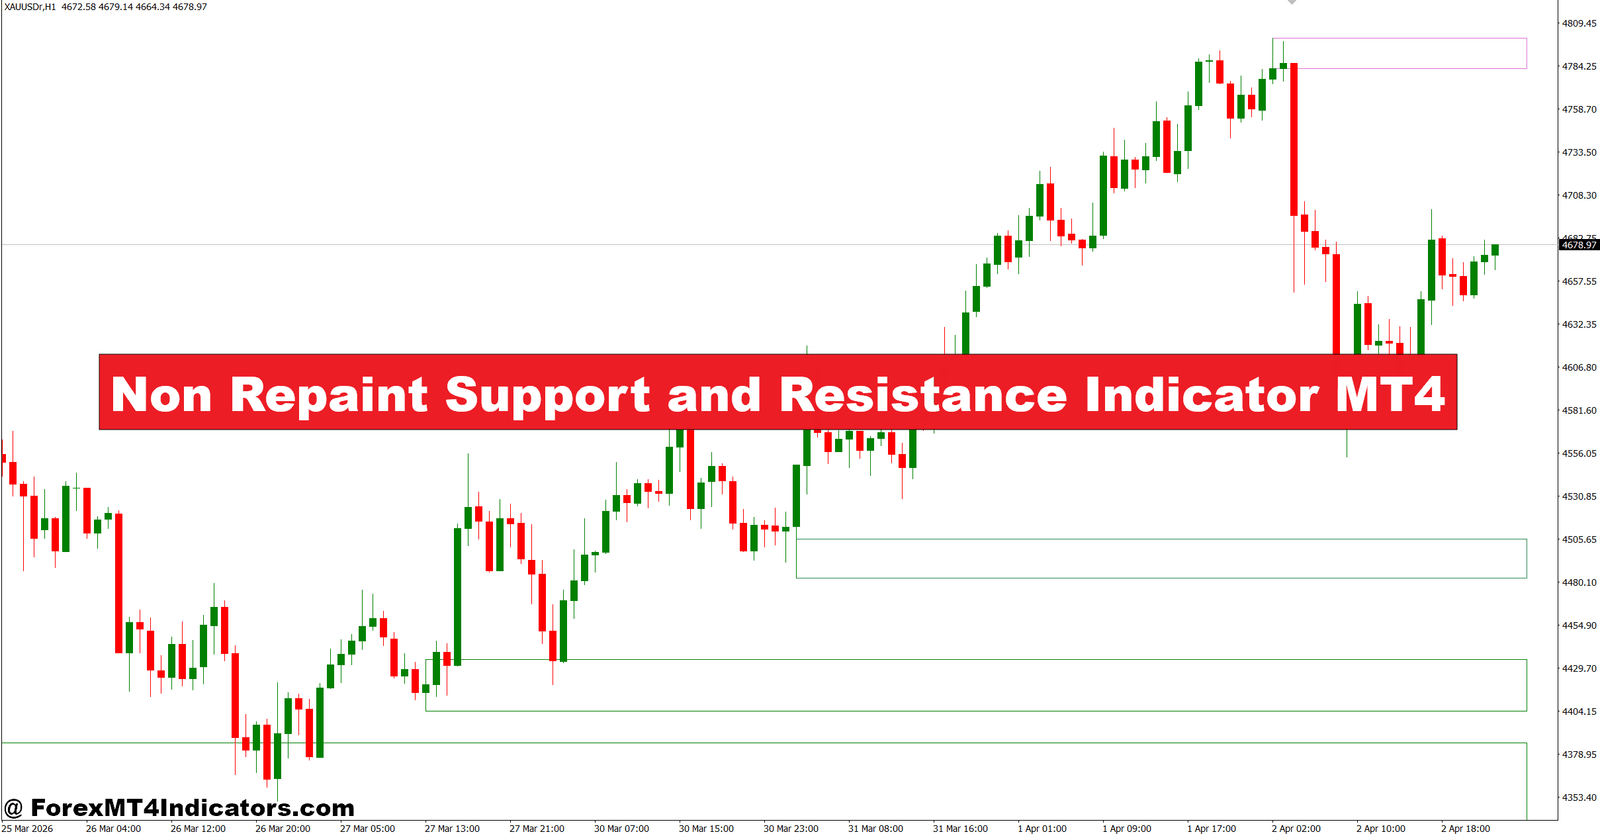
The Non Repaint Support and Resistance Indicator MT4 was designed to solve that problem by keeping plotted levels fixed after they appear. Traders don’t have to wonder if yesterday’s support will disappear or if resistance will move after the next candle forms. Stable levels make trade planning much easier and reduce second-guessing during active market sessions.
A reliable support and resistance tool doesn’t replace trading skills, but it gives traders a more consistent view of market structure. The sections below explain how this indicator works, where it performs best, and how traders can use it alongside price action to improve trade decisions.
Understanding the Non Repaint Support and Resistance Indicator MT4
Support and resistance are areas where buyers or sellers have previously taken control of the market. Instead of drawing these zones manually, this MT4 indicator identifies important swing highs and swing lows and converts them into horizontal levels that remain unchanged after confirmation.
The “non repaint” feature is what separates it from many free indicators. Once a level has been confirmed, it stays on the chart instead of shifting with new price data. That allows traders to review past signals accurately and build confidence during backtesting.
Most versions of this indicator rely on recent market structure. They examine a set number of candles, identify significant turning points, and ignore minor fluctuations that often create false levels. The result is a cleaner chart with fewer distractions.
On EUR/USD, for example, a support level created after a clear swing low on the 1-hour chart may remain valid for several trading sessions until price decisively breaks below it. This gives traders enough time to prepare rather than chasing every small movement.
How the Indicator Works in Real Trading
The calculation logic focuses on confirmed swing points instead of predicting future price movement. After enough candles close to validate a high or low, the indicator plots a horizontal support or resistance line.
This confirmation process means the indicator may appear one or two candles later than aggressive repainting tools. That’s a worthwhile trade-off because the level is based on completed market information instead of assumptions.
Imagine GBP/USD trading near 1.3420 on the 4-hour chart. Price rejects that level twice before moving higher. The indicator marks this area as support. Two days later, price retraces toward the same zone during the London session. Instead of entering immediately, traders often wait for a bullish engulfing candle or a strong rejection wick before buying. That extra confirmation helps avoid fake-outs.
During strong trends, resistance often becomes new support after a breakout. The indicator helps traders recognize these role reversals without constantly redrawing chart levels.
When testing this on volatile NFP days, traders often notice that waiting for the candle to close before acting produces more reliable decisions. Large news candles can temporarily break support or resistance before quickly returning inside the range.
Trading forex carries substantial risk. No indicator guarantees profits.
Practical Trading Applications
Using Support Levels for Buy Setups
A common strategy involves waiting for price to revisit a confirmed support area during an established uptrend.
For example:
- Currency pair: EUR/USD
- Timeframe: 1-hour
- Trend: Higher highs and higher lows
- Entry: Bullish rejection candle at support
- Stop-loss: 20-25 pips below support
- Initial target: 40-60 pips near the previous swing high
Many traders improve the setup by checking if the 50-period Exponential Moving Average is also acting as dynamic support. When both signals agree, confidence usually increases.
Using Resistance Levels for Sell Setups
The same idea works in reverse during downtrends.
Suppose USD/JPY rallies into a confirmed resistance level on the 4-hour chart. Price prints a bearish pin bar while the RSI remains above 70 before turning lower. Some traders enter after the candle closes, placing the stop-loss about 25 pips above resistance and aiming for a reward at least twice the initial risk.
Here’s the thing: support and resistance should be treated as zones instead of exact prices. Markets rarely reverse at a single pip.
Best Settings and How It Compares with Similar Indicators

Most versions of this indicator work well with their default settings, but adjustments can help different trading styles.
Scalpers on the 5-minute or 15-minute chart often reduce the swing sensitivity to identify more trading opportunities. Swing traders using the 4-hour or daily chart usually increase the lookback period to focus on stronger institutional levels.
Popular combinations include:
- EUR/USD: 1-hour with default sensitivity
- GBP/USD: 4-hour with a slightly wider swing filter
- XAU/USD (Gold): 1-hour combined with ATR for stop placement
- USD/CAD: Daily chart for long-term position trading
Compared with manually drawing support and resistance, this indicator saves time and applies consistent rules. Compared with pivot point indicators, it reacts to actual market structure instead of fixed daily calculations. Fractal indicators can also identify swing points, but they often produce more short-term levels that clutter the chart.
Still, no indicator is perfect.
Strong news events can push price through even the best support or resistance zones. Low-liquidity sessions may also create false breakouts before the market returns to its original direction. Traders should always confirm entries with candlestick patterns, volume analysis if available, or broader trend direction.
Many experienced traders also avoid opening new positions when price sits directly between major support and resistance. That middle area often produces sideways movement and whipsaw price action.
How to Trade with Non Repaint Support and Resistance Indicator MT4
Buy Entry

- Buy at confirmed support – Enter after a bullish candle closes at a support level on EUR/USD 1-hour. Place a 20-25 pip stop-loss.
- Wait for a rejection wick – Buy only if price rejects support with a long lower wick. Aim for 40-60 pips profit.
- Trade with the trend – Take buy signals only when the 4-hour trend is bullish to improve trade quality.
- Use EMA confirmation – Enter if price bounces from support above the 50 EMA for extra confirmation.
- Risk only 1-2% – Limit each trade to 1-2% of account balance to control drawdowns.
- Buy after a retest – Enter when broken resistance becomes new support on GBP/USD 1-hour.
- Avoid major news – Skip buy entries 30 minutes before and after high-impact news releases.
- Ignore weak support – Don’t buy if price closes 15+ pips below the support level.
Sell Entry

- Sell at confirmed resistance – Enter after a bearish candle closes at resistance on GBP/USD 4-hour. Use a 20-30 pip stop-loss.
- Wait for bearish rejection – Sell after a pin bar or engulfing candle forms at resistance. Target 50-80 pips.
- Follow the downtrend – Take sell trades only when the daily trend remains bearish.
- Use moving average confirmation – Sell when price rejects resistance below the 50 EMA.
- Protect your capital – Risk no more than 2% per trade and maintain at least a 1:2 risk-reward ratio.
- Sell the resistance retest – Enter after price retests broken support as new resistance on EUR/USD 1-hour.
- Avoid ranging markets – Skip sell signals if price is moving sideways within a 20-30 pip range.
- Ignore false breakouts – Don’t sell unless the rejection candle closes back below the resistance level.
Final Thoughts
The Non Repaint Support and Resistance Indicator MT4 offers traders a practical way to identify stable market levels without worrying about signals changing after the fact. It helps simplify chart analysis, supports disciplined trade planning, and works well alongside price action rather than replacing it. Traders can benefit by combining confirmed support and resistance zones with trend analysis, waiting for candle-close confirmation before entering, keeping realistic stop-loss levels based on market volatility, and managing risk on every trade. Like any technical analysis tool, it performs best when used as part of a complete trading plan. Those who spend time testing the indicator across different currency pairs and market conditions will gain a better understanding of where it delivers the most reliable results.
Recommended MT4/MT5 Broker
XM Broker
- *FREE $50 To Start Trading Instantly! (Withdraw-able Profit)
- Deposit Bonus up to $5,000
- Unlimited Loyalty Program
- Award Winning Forex Broker
- Additional Exclusive Bonuses Throughout The Year

>> Sign Up for XM Broker Account here <<


