


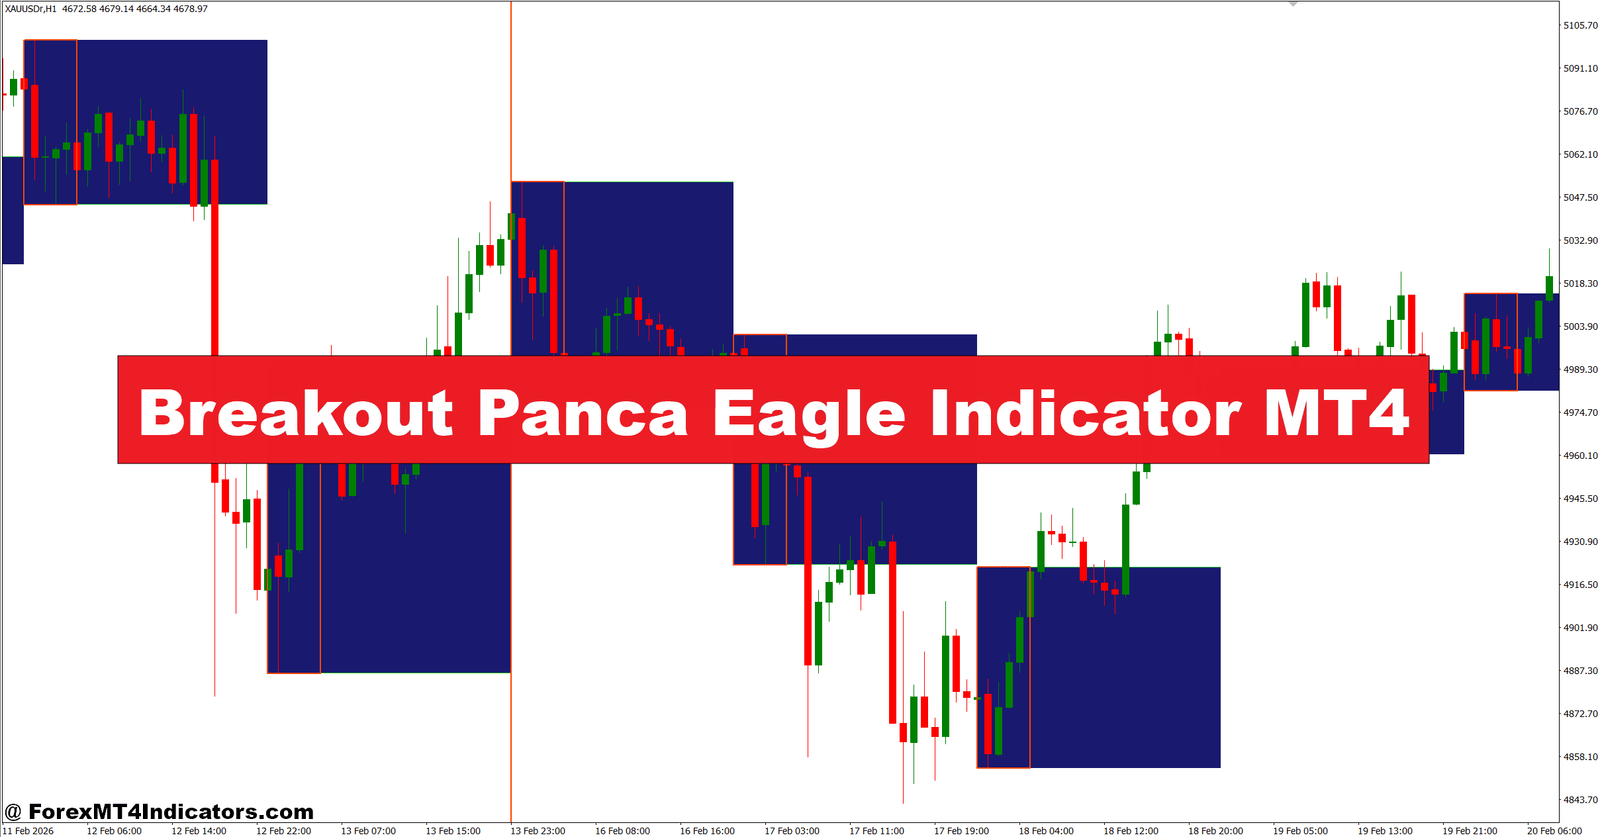
The Breakout Panca Eagle Indicator MT4 attracts traders who struggle with one common problem—entering the market too early or too late during a breakout. A price move can look convincing, only to reverse a few candles later and trigger a stop-loss. That kind of fake-out isn’t just frustrating. It can slowly reduce trading confidence and lead to poor decisions in the next setup.
Many traders have experienced watching EUR/USD break above resistance, jumping into a trade, and then seeing the market fall right back into the previous range. After a few losses like that, some traders hesitate to take the next valid signal, missing profitable opportunities. The Breakout Panca Eagle Indicator MT4 aims to reduce that uncertainty by highlighting breakout areas with clearer confirmation based on price movement rather than emotion.
No indicator can predict every move, but a well-tested breakout tool can help traders build a more disciplined trading process. The sections below explain how this indicator works, where it performs best, and how traders can use it alongside sound risk management.
What Is the Breakout Panca Eagle Indicator MT4?
The Breakout Panca Eagle Indicator MT4 is a technical analysis tool designed to identify potential breakout opportunities after price escapes a consolidation zone, support level, or resistance level. Instead of guessing when momentum will begin, the indicator waits for conditions that suggest buyers or sellers have gained control.
Most versions display arrows, colored bars, or breakout signals directly on the chart. Some also highlight important price zones where a breakout is likely to occur. This makes it easier to recognize high-probability trading areas without manually drawing every support and resistance level.
Unlike simple moving average systems that react after trends develop, this indicator focuses on the beginning of a momentum move. That gives traders an opportunity to enter closer to the start of a trend while keeping stop-loss distances relatively small.
Still, breakout trading isn’t perfect. During quiet markets or low-volume sessions, false breakouts can appear more frequently.
How the Indicator Detects Breakouts
The exact calculation depends on the version installed, but the indicator generally combines recent price highs and lows with candle momentum. Some versions also evaluate volatility by measuring candle size or average price movement before generating a signal.
Here’s how the logic usually works:
- Price forms a narrow trading range.
- Buying or selling pressure begins to increase.
- A candle closes outside the established range.
- The indicator confirms the breakout and plots a signal.
For example, EUR/USD on the 1-hour chart may spend eight hours trading between 1.1180 and 1.1200. Once a strong bullish candle closes above 1.1200 with increased momentum, the indicator may generate a buy signal. A trader could place a stop-loss 20-25 pips below the breakout level while targeting 45-60 pips if the trend continues.
During testing on volatile NFP trading days, breakout signals often appeared earlier than moving average crossovers. But price also produced more fake breakouts immediately after major news releases. Waiting for the breakout candle to close reduced several unnecessary entries.
That’s one practical lesson experienced traders often learn after enough screen time.
Applying the Breakout Panca Eagle Indicator in Live Trading

The indicator performs best when traders combine it with market structure instead of relying on signals alone.
One common approach involves identifying the higher-timeframe trend first. If GBP/USD is making higher highs on the 4-hour chart, traders can switch to the 30-minute or 1-hour timeframe and look only for bullish breakout signals. This simple filter removes many lower-quality trades.
Another example involves USD/JPY during the London session. Suppose price spends several hours moving sideways between 147.20 and 147.45. When buyers finally push above resistance and the indicator prints a buy arrow, traders may wait for a small pullback before entering instead of chasing the first breakout candle. This often improves the reward-to-risk ratio.
Some traders also combine the indicator with:
Trend Confirmation
A 50-period EMA or 200-period EMA helps identify overall market direction. Breakouts that agree with the prevailing trend usually have a higher probability than those moving against it.
Volume or Momentum Filters
Although MT4 uses tick volume instead of centralized forex volume, stronger breakout candles often show increased activity. Pairing the indicator with RSI above 55 for buys or below 45 for sells can provide another layer of confirmation.
Stop-Loss Placement
Rather than using a fixed stop-loss, many traders place it behind the breakout candle or the nearest swing high or swing low. On major pairs, this commonly ranges from 15 to 35 pips depending on volatility.
Trading forex carries substantial risk. No indicator guarantees profits. Every trade should include a predefined stop-loss and position size that matches the trader’s risk tolerance.
Settings, Strengths, and Limitations
Most traders leave the default settings unchanged when first installing the indicator. After gathering enough data, they gradually adjust the sensitivity based on their preferred trading style.
For scalping on the M5 or M15 charts, slightly lower sensitivity may produce faster signals, although this usually increases false alerts during choppy conditions.
Swing traders often prefer the H4 or Daily chart because stronger breakouts develop with less market noise. Signals appear less often, but they generally require fewer trades to capture larger price movements.
The indicator works particularly well on actively traded pairs such as:
- EUR/USD
- GBP/USD
- USD/JPY
- AUD/USD
- XAU/USD (Gold) during active trading sessions
Like any breakout system, it has limitations.
Range-bound markets can produce repeated whipsaws. During holiday sessions or periods of extremely low volatility, price may briefly move outside support or resistance before reversing. Traders who ignore the overall trend or enter before candle close usually experience more losing trades.
Compared with standard breakout methods that rely only on manually drawn support and resistance, the Breakout Panca Eagle Indicator MT4 saves time by automatically highlighting trading opportunities. Compared with Bollinger Bands, it focuses more on directional breakouts instead of volatility expansion alone. Against Donchian Channels, it often provides cleaner visual entry signals, though Donchian systems remain popular for longer-term trend followers.
No single tool replaces proper chart reading. Price action, market structure, and risk management still determine long-term consistency.
How to Trade with Breakout Panca Eagle Indicator MT4
Buy Entry

- Wait for a bullish breakout – Enter after a 1-hour candle closes above resistance with the indicator’s buy signal.
- Trade with the main trend – Take buy trades only when the 4-hour trend is bullish on EUR/USD or GBP/USD.
- Confirm candle strength – Choose breakout candles that are at least 20-30 pips to avoid weak moves.
- Buy after a retest – Enter when price retests the breakout level and holds as new support.
- Place a tight stop-loss – Keep the stop-loss 15-30 pips below the breakout zone or recent swing low.
- Target a healthy reward – Aim for at least a 1:2 risk-to-reward ratio or 40-80 pips profit.
- Avoid low-volume sessions – Skip buy signals during the late New York session or before major news releases.
- Risk only 1-2% per trade – Protect capital even when multiple buy signals appear.
Sell Entry

- Wait for a bearish breakout – Sell after a 1-hour candle closes below support with a confirmed sell signal.
- Follow the higher-timeframe trend – Look for sells only when the 4-hour or daily trend is bearish.
- Confirm strong momentum – Prefer bearish breakout candles of 20-30 pips or more on GBP/USD.
- Sell after resistance retest – Enter when price retests the broken support and fails to move higher.
- Set a controlled stop-loss – Place the stop 15-30 pips above the breakout candle or swing high.
- Take realistic profit targets – Secure profits at 40-80 pips or maintain a minimum 1:2 risk-to-reward ratio.
- Avoid ranging markets – Ignore sell signals when EUR/USD is moving sideways in a tight range.
- Manage trade size carefully – Risk no more than 1-2% of account balance on each sell trade.
The Breakout Panca Eagle Indicator MT4 offers a structured way to identify momentum trades without constantly guessing when price will leave a consolidation range. Traders often appreciate its visual breakout signals, the ability to work across several timeframes, and its compatibility with trend-following strategies. At the same time, they should remember three key points: breakout confirmation matters more than speed, higher-timeframe trend analysis improves signal quality, and disciplined risk management is essential after every entry. Used alongside support and resistance analysis rather than as a standalone decision-maker, the Breakout Panca Eagle Indicator MT4 can become a valuable part of a balanced trading plan built on patience instead of impulse.
Recommended MT4/MT5 Broker
XM Broker
- *FREE $50 To Start Trading Instantly! (Withdraw-able Profit)
- Deposit Bonus up to $5,000
- Unlimited Loyalty Program
- Award Winning Forex Broker
- Additional Exclusive Bonuses Throughout The Year

>> Sign Up for XM Broker Account here <<


