


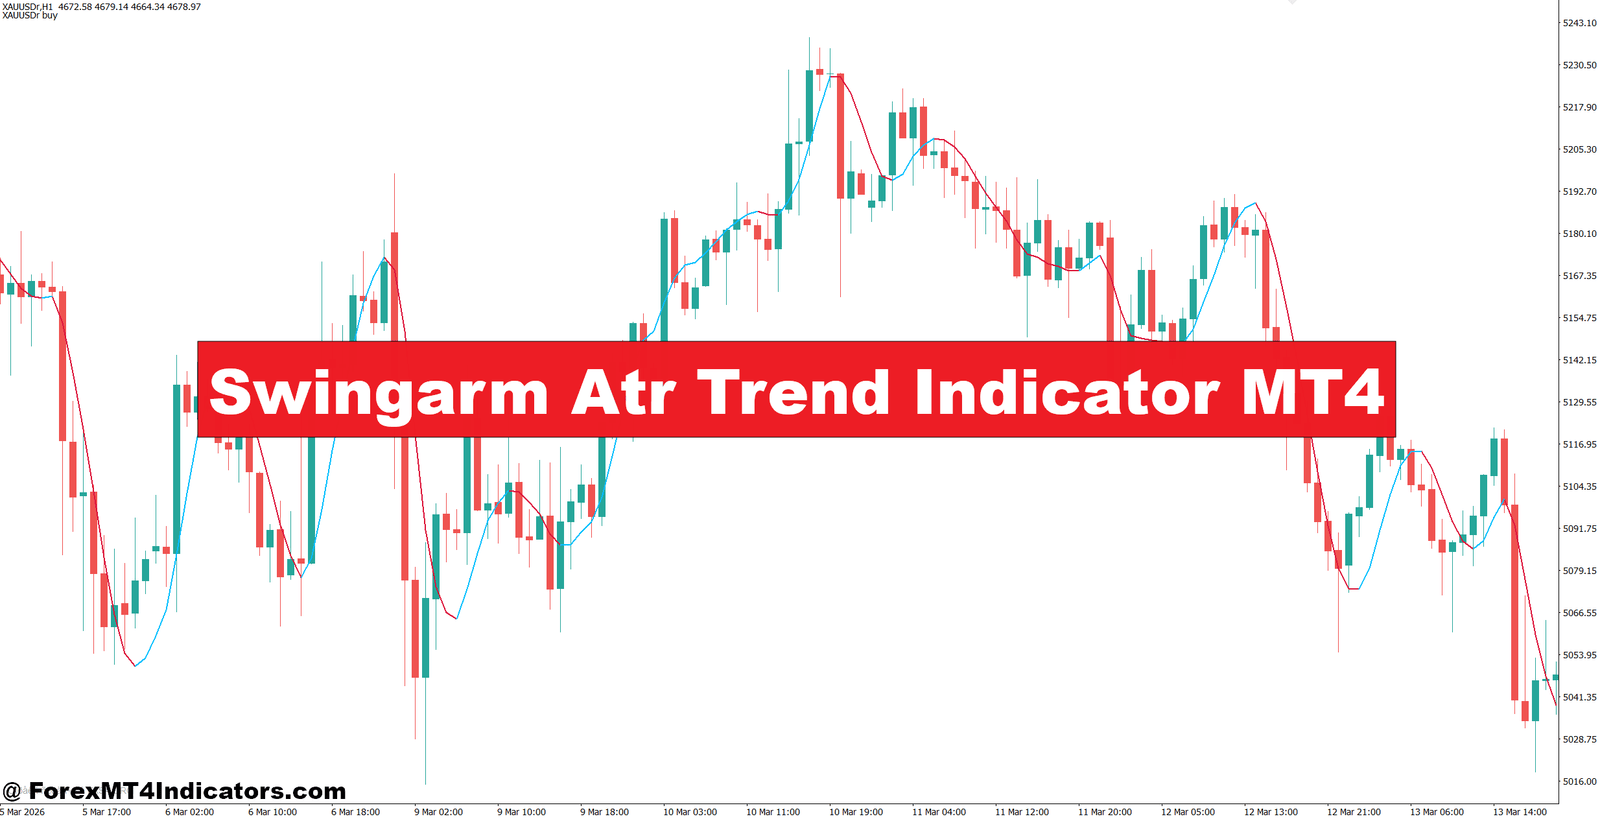
The Swingarm ATR Trend Indicator MT4 was designed to help reduce that problem by combining trend direction with market volatility. Instead of reacting to every price fluctuation, it highlights meaningful trend changes while filtering out much of the normal market noise.
The challenge becomes even bigger during active trading sessions like London or New York, where volatility rises quickly. Traders who rely only on moving averages or simple crossover signals often find themselves caught in fake breakouts. This indicator attempts to solve that issue by adapting its trend calculation to changing volatility through the Average True Range (ATR). As a result, traders receive signals that are more responsive during strong trends and less sensitive during sideways conditions. Before adding it to any trading strategy, it’s worth understanding exactly how it works and where it performs best.
What Is the Swingarm ATR Trend Indicator MT4?
The Swingarm ATR Trend Indicator MT4 is a trend-following technical analysis tool that uses the Average True Range to calculate dynamic trend levels. Instead of plotting fixed support or resistance lines, it adjusts according to current market volatility.
ATR measures how much price moves over a selected number of candles. When volatility increases, the indicator widens its distance from price to avoid reacting to normal market swings. During quieter sessions, the distance becomes smaller, allowing earlier trend recognition.
Many traders compare it to volatility-based trailing stop indicators, but Swingarm ATR Trend focuses more on identifying trend direction than simply managing exits. It can appear as colored lines, arrows, or changing trend zones depending on the version installed in MetaTrader 4.
The indicator works well with major forex pairs such as EUR/USD, GBP/USD, USD/JPY, and AUD/USD, especially on the H1, H4, and Daily charts where market trends tend to be more reliable.
How the Swingarm ATR Trend Indicator Calculates Trends

Unlike a standard moving average that only smooths price, this indicator uses ATR as part of its calculation to determine whether price movement is significant enough to qualify as a trend change.
The basic logic follows three main steps:
- ATR calculates average market volatility over a selected period, often 14 candles.
- The indicator places dynamic trend levels above or below recent price swings using an ATR multiplier.
- A confirmed trend change occurs only when price closes beyond those calculated levels.
This approach helps ignore many small pullbacks that often trigger false entries with traditional indicators.
For example, suppose EUR/USD is trading on the 1-hour chart with a 14-period ATR reading of 18 pips. If the ATR multiplier is set to 2.0, the trend line stays approximately 36 pips away from recent swing points. Small retracements remain inside that range, while stronger moves produce a genuine trend reversal signal.
During testing on volatile NFP trading days, the indicator generally filtered out several quick spikes that would have triggered early exits using a simple 20 EMA. It wasn’t perfect, but it handled sudden volatility better than fixed-distance indicators.
Practical Trading Applications
The Swingarm ATR Trend Indicator MT4 performs best when combined with market structure instead of acting as a standalone signal generator.
A common setup involves waiting for three conditions:
- Price closes above the ATR trend line.
- Market forms a higher high after breaking resistance.
- Volume or momentum confirms the move.
For example, GBP/USD on the 4-hour chart may break above resistance at 1.2850 while the indicator changes from bearish to bullish. Rather than entering immediately, many traders wait for a pullback toward the breakout area. If buyers defend that level and the trend line remains bullish, the setup often provides a better risk-to-reward ratio.
Another practical example comes from USD/JPY on the Daily chart. After several weeks of consolidation, price closed above the ATR trend level and continued climbing nearly 240 pips over the following sessions. Traders who entered after confirmation avoided much of the early sideways movement.
Here’s the thing: no trend indicator can eliminate fake-outs during ranging markets. When price remains trapped inside a narrow 40-60 pip range, ATR values decrease, and signals may become less reliable. Waiting for support or resistance breaks alongside the indicator usually improves trade quality.
Trading forex carries substantial risk. No indicator guarantees profits. Risk management should always include predefined stop-loss levels and position sizing that matches the trader’s account.
Settings, Customization, and Comparison
Recommended Settings
Most traders begin with the default ATR period of 14 because it reflects recent market conditions without becoming overly sensitive.
Some common adjustments include:
- Scalping (M5-M15): ATR Period 10-12 with a lower multiplier around 1.5.
- Intraday trading (H1): ATR Period 14 and multiplier between 2.0 and 2.5.
- Swing trading (H4-Daily): ATR Period 20 with multiplier from 2.5 to 3.0.
Higher multipliers reduce signal frequency but often filter more market noise.
Strengths and Weaknesses
One advantage is its ability to adapt automatically as volatility changes. Traders don’t need to constantly adjust fixed stop distances after every major news release.
Another strength is trend persistence. Strong directional moves stay active longer because temporary pullbacks rarely trigger immediate reversals.
The downside appears during flat markets. Like many trend-following indicators, Swingarm ATR Trend may generate multiple losing trades when price lacks clear direction. It also reacts after price has already started moving since ATR calculations require completed candles.
Comparison With Similar Indicators
Compared with a Supertrend Indicator, Swingarm ATR Trend often produces similar directional signals because both rely on ATR calculations. The difference is that Swingarm versions usually place greater emphasis on swing highs and swing lows before confirming trend changes.
Against a traditional 50-period EMA, the ATR-based approach adjusts automatically as volatility expands. A moving average keeps the same mathematical behavior regardless of market conditions, while ATR responds to changing price ranges.
Compared with Parabolic SAR, Swingarm ATR Trend generally produces fewer signals in strong trends. Parabolic SAR often flips direction during deep pullbacks, while ATR filtering allows trades more room to develop.
That doesn’t make one better than another. Many experienced traders combine ATR trend confirmation with moving averages or support and resistance analysis instead of depending on a single indicator.
How to Trade with Swingarm Atr Trend Indicator MT4
Buy Entry

- Wait for a bullish trend flip – Enter a buy when the Swingarm ATR Trend Indicator turns bullish on the 1-hour or 4-hour chart after a candle closes.
- Trade above key resistance – Buy only if EUR/USD breaks resistance by 10-15 pips with the indicator confirming the trend.
- Confirm with higher highs – Take the trade when price forms a higher high and higher low while the indicator stays bullish.
- Use ATR as your stop – Place the stop-loss 20-40 pips below the recent swing low or 1.5× ATR.
- Target a 1:2 reward ratio – Risk 30 pips to aim for at least 60 pips on trending markets.
- Trade active sessions – Focus on London and New York sessions for stronger momentum on GBP/USD.
- Skip sideways markets – Don’t buy if price has moved inside a 30-40 pip range for several candles.
- Risk only 1-2% – Keep position size small even if the indicator gives a strong buy signal.
Sell Entry

- Wait for a bearish trend flip – Sell after the Swingarm ATR Trend Indicator turns bearish on the 1-hour or Daily chart.
- Sell below support – Enter only when GBP/USD closes 10-15 pips below support with trend confirmation.
- Confirm lower lows – Look for lower highs and lower lows before opening a short position.
- Set a protective stop – Place the stop-loss 20-40 pips above the recent swing high or 1.5× ATR.
- Aim for 1:2 risk-reward – Risk 25 pips to target around 50 pips or more.
- Avoid major news events – Don’t sell 15-30 minutes before high-impact news like NFP or CPI.
- Ignore weak signals in ranges – Skip trades if EUR/USD is stuck inside a 30-pip consolidation zone.
- Protect your capital – Never risk more than 2% of your account on a single sell trade.
Final Thoughts
The Swingarm ATR Trend Indicator MT4 offers a practical way to identify trend direction while adapting to changing market volatility. Traders often appreciate its ability to filter smaller price swings, provide clearer trend confirmation, and work well alongside support and resistance rather than replacing price action analysis. It performs best on higher timeframes where trends have room to develop, though ranging markets can still produce false signals. Like any technical tool, it should be tested in a demo account before risking real capital. Used with disciplined risk management and solid trade planning, the Swingarm ATR Trend Indicator MT4 can become a valuable part of a balanced forex trading strategy instead of the sole basis for trading decisions.
Recommended MT4/MT5 Broker
XM Broker
- *FREE $50 To Start Trading Instantly! (Withdraw-able Profit)
- Deposit Bonus up to $5,000
- Unlimited Loyalty Program
- Award Winning Forex Broker
- Additional Exclusive Bonuses Throughout The Year

>> Sign Up for XM Broker Account here <<


