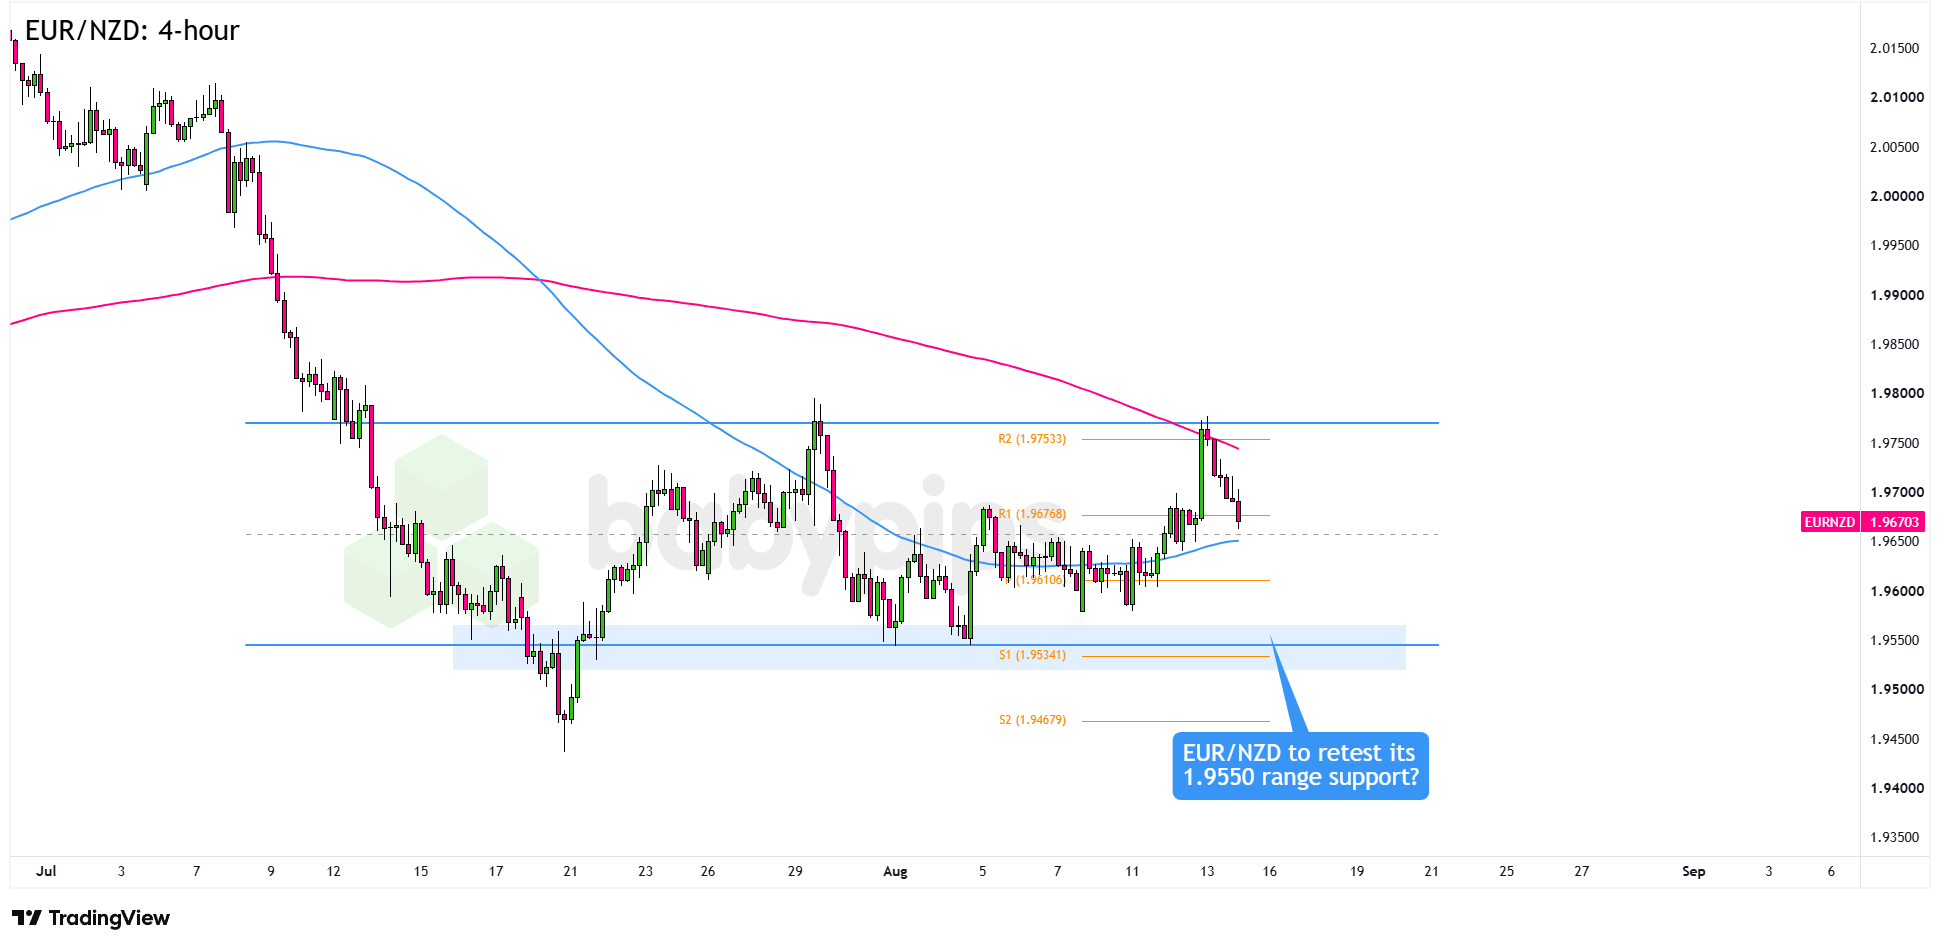
EUR/NZD tagged the top of its two-month range near 1.9750 and is now sliding back toward the lower half of the consolidation.
Could sellers be setting their sights on another test of the 1.9550 range floor?
EUR/NZD 4-hour Forex Chart Faster with TradingView
The euro heads into Friday with the Euro Area’s second estimate of Q2 GDP and preliminary employment figures due during the London open. Meanwhile, the Kiwi caught a lift after Thursday’s softer-than-expected U.S. PPI report pushed September Fed hike odds below 40% and boosted risk appetite.
Still, New Zealand’s Q3 business inflation expectations fell sharply to 2.34%, missing the 2.7% forecast and cooling RBNZ tightening bets ahead of its September 2 meeting. That could limit the Kiwi’s upside and put more weight on Friday’s Euro Area data.
Remember that directional biases and volatility conditions in market price are typically driven by fundamentals. If you haven’t yet done your homework on the New Zealand dollar and the euro, then it’s time to check out the economic calendar and stay updated on daily fundamental news!
EUR/NZD spiked into R2 at 1.9753 before sellers took control, pulling the pair back below R1 at 1.9677 and toward its current level near 1.9670. This keeps the broader trend bearish and leaves plenty of dynamic resistance overhead.
The immediate test is the middle of the range near 1.9650, followed by the weekly Pivot Point at 1.9611. A clean break below those levels would bring the 1.9550 range floor into focus. As you can see, that area has held on at least three separate tests since mid-July and sits close to S1 at 1.9534.
If Euro Area GDP and employment data beat expectations and risk sentiment cools, EUR/NZD could attract buyers around 1.9650 and recover toward R1 at 1.9677. A sustained move above R1 would reopen the path toward the 1.9750 range resistance.
On the other hand, continued demand for the Kiwi and disappointing Euro Area data could push EUR/NZD below 1.9650 and the 1.9611 Pivot Point. That would open the door to another test of the 1.9550 range support. A close below that support could then expose S2 at 1.9468 and shift the range bias back in favor of the bears.
Whichever bias you end up trading, don’t forget to practice proper risk management and stay aware of top-tier catalysts that could influence overall market sentiment.
Please be aware that the technical analysis content provided herein is for informational and educational purposes only. It should not be construed as trading advice or a suggestion of any specific directional bias. Technical analysis is just one aspect of a comprehensive trading strategy. The technical setups discussed are intended to highlight potential areas of interest that other traders may be observing. Ultimately, all trading decisions, risk management strategies, and their resulting outcomes are the sole responsibility of each individual trader. Please trade responsibly.
This EUR/NZD setup is built around a two-month consolidation range, and traders new to range analysis may not be familiar with how to read price behavior at range boundaries. Premium members can read our lesson:
📖 What Is a Range-Bound Market?
Reading this helps you understand how to identify a range-bound market, how support and resistance levels function as range floors and ceilings, and how to set up trade scenarios around a consolidation’s key boundaries.
And if you’re not a Premium subscriber yet, consider joining today.
With Babypips Premium, you get full access to School of Pipsology lessons that help you understand not just what the chart is showing, but the range mechanics and key level logic that structure the trade setups.