


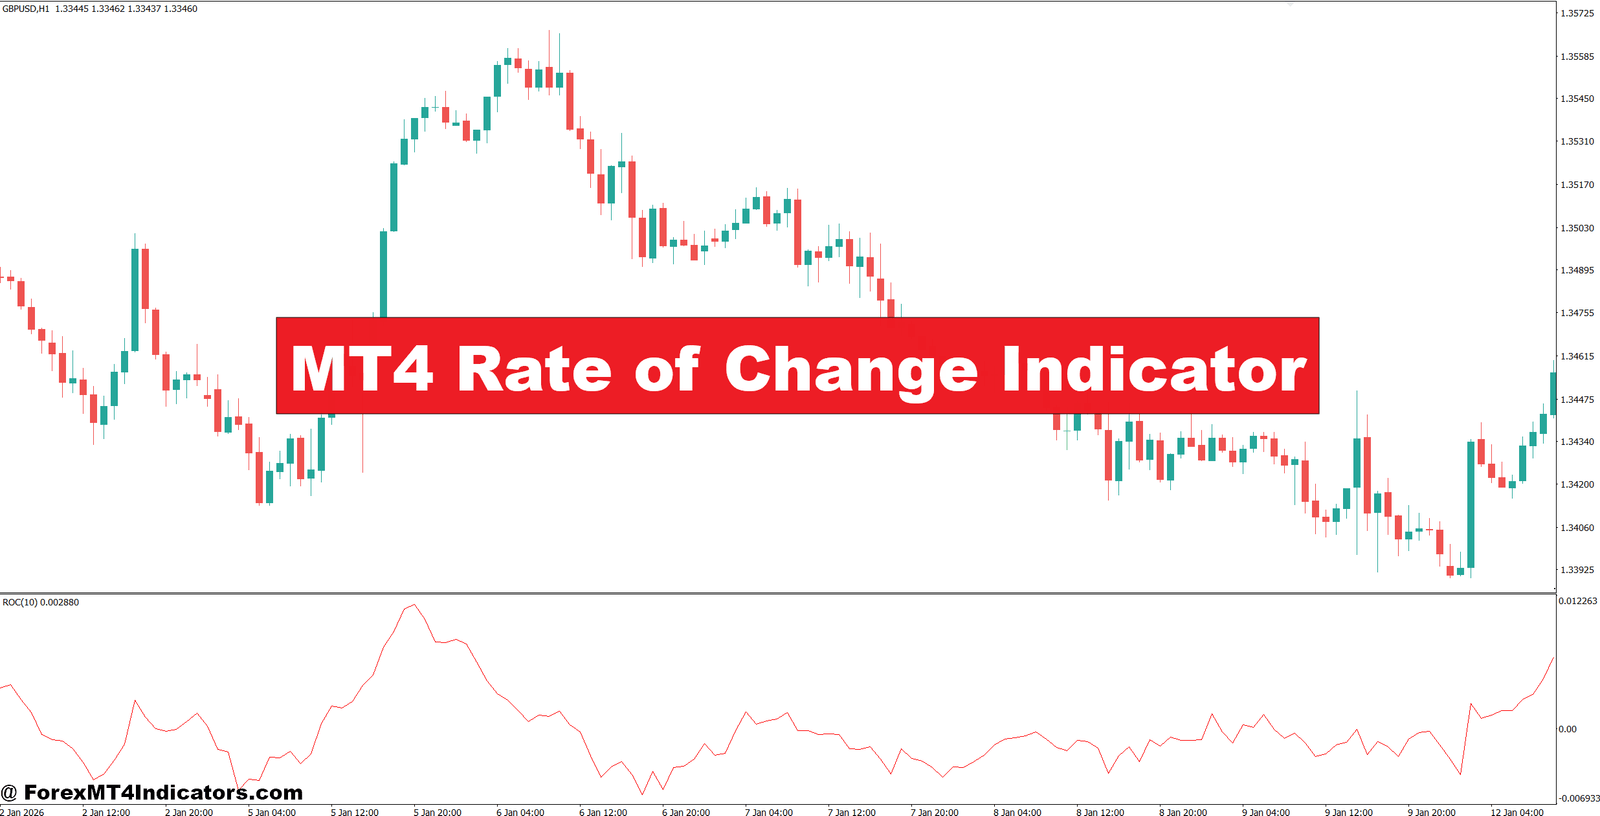
A trader can have the right market direction and still enter at the wrong time. For example, EUR/USD may be trending higher on the 1-hour chart, but a buy taken after a sharp 35-pip move can quickly turn into a frustrating pullback. This is where momentum analysis becomes useful. The MT4 Rate of Change Indicator helps traders measure how quickly price is moving compared with its level from a previous period.
The problem is that price direction alone does not show whether momentum is strengthening or fading. A late entry can lead to a 20–30 pip drawdown even when the broader trend remains bullish. Repeated fake-outs like these can damage both an account and a trader’s confidence.
The Rate of Change indicator adds another layer by showing the percentage change in price over a selected number of candles. Traders can then compare momentum with support, resistance, trend structure, and price action. In practice, it works best as a confirmation tool rather than a standalone buy or sell system.
What Is the MT4 Rate of Change Indicator?
Rate of Change, commonly called ROC, is a momentum oscillator that measures the percentage difference between the current price and its price a specific number of periods ago.
The basic calculation is:
ROC = [(Current Price − Price N Periods Ago) ÷ Price N Periods Ago] × 100
If the current EUR/USD price is 1.0850 and the price 14 candles earlier was 1.0800, the calculation would be:
(1.0850 − 1.0800) ÷ 1.0800 × 100 = approximately +0.46%.
A positive reading means price is higher than it was N periods ago. A negative reading means price is lower.
The key point is that ROC measures momentum, not trend direction by itself. A market can still be above a major support level while ROC is falling. That may signal weakening upside pressure rather than an immediate sell signal.
How ROC Works in Real Forex Trading
The most useful way to read the indicator is alongside price structure. Traders often watch the zero line, changes in momentum, and divergences between price and ROC.
Zero-Line Momentum
When ROC moves above zero, the current price is higher than its reference price. When it drops below zero, price is lower.
For example, suppose GBP/USD is trading around 1.2740 on the 1-hour chart. ROC has moved from -0.30% to +0.18%, while price breaks above a resistance level at 1.2725. That combination provides stronger bullish evidence than ROC crossing above zero by itself.
A trader could wait for the breakout candle to close and then look for a retest of 1.2725. If the retest holds and ROC remains positive, a buy entry may offer a cleaner risk-to-reward setup.
Momentum Acceleration
ROC can also help show when a move is gaining speed. If EUR/USD moves from a ROC reading of +0.10% to +0.55% while breaking a recent swing high, buying pressure is increasing.
But traders should avoid chasing the move after an unusually large candle. If a pair has already traveled 50–60 pips from a nearby support zone, waiting for a pullback may reduce entry risk.
Divergence Between Price and ROC
Divergence deserves attention. Suppose USD/JPY reaches a new high of 158.40, but ROC produces a lower peak than it did at the previous price high. Price is rising, yet momentum is not keeping pace.
That does not mean an immediate short position is justified. Instead, it warns traders to watch for a structure break, rejection candle, or move below nearby support.
The same principle works for bullish divergence. If gold or EUR/USD forms a lower low while ROC forms a higher low, selling pressure may be fading. Traders can then wait for price to reclaim a short-term resistance level before considering a long trade.
Practical Settings for Different Timeframes

The ROC period has a major effect on its behavior. A shorter setting reacts faster but can produce more noise. A longer setting gives smoother readings but may respond late.
A 9-period ROC can suit aggressive intraday trading on M5 or M15 charts. It reacts quickly to short momentum bursts, but traders should expect more whipsaw during sideways sessions.
A 14-period ROC provides a useful middle ground for many M15 and H1 setups. For example, a trader watching EUR/USD on H1 could use 14 periods to compare current momentum with the price 14 hours earlier.
A 20- or 25-period ROC can be more useful on H4 charts where the goal is to identify broader momentum rather than every small intraday move.
Pair behavior also matters. GBP/JPY can make much larger intraday swings than EUR/USD, so fixed pip expectations should not be copied from one pair to another. Volatility-based stops, such as using recent swing distance or a portion of ATR, are often more practical.
When testing the indicator on volatile NFP days, traders may see ROC jump sharply within one or two candles. Those readings can be useful, but entering during the first news spike carries much greater slippage and reversal risk.
Advantages, Limitations, and Comparison With Other Indicators
One strength of ROC is its simplicity. It directly measures price momentum without requiring a complicated formula. Traders can quickly see whether current price is stronger or weaker than its earlier level.
It also works well with market structure. A bullish ROC reading becomes more meaningful when price is making higher highs and higher lows. Likewise, negative momentum carries more weight when price is breaking support in an established downtrend.
Still, ROC has weaknesses. It can remain positive during a falling market correction and negative during a temporary pullback inside a strong uptrend. It can also become noisy on lower timeframes.
Compared with the RSI, ROC focuses directly on percentage price change, while RSI measures the balance of recent gains and losses and is commonly used for momentum and overbought/oversold analysis. RSI can stay above 70 during a strong trend, just as ROC can remain strongly positive.
Compared with the MACD, ROC is more direct because it does not rely on the difference between moving averages. MACD generally provides more information about trend and momentum changes, while ROC offers a cleaner view of the rate at which price has changed.
For traders who already use moving averages, support and resistance, or candlestick structure, ROC can fit naturally into the existing method instead of replacing it.
A practical setup might look like this: EUR/USD is above its 50-period moving average on H1, price pulls back toward previous support at 1.0820, and ROC falls from +0.40% to +0.05%. If price rejects 1.0820 and ROC turns upward again, the trader has several pieces of evidence pointing in the same direction. A stop could sit below the recent swing low, while the first target might be 25–40 pips higher depending on market volatility.
That said, no indicator should override a poor risk-to-reward setup. If the potential reward is only 15 pips and the logical stop requires 35 pips, the trade may not be worth taking even when ROC looks favorable.
How to Trade with MT4 Rate of Change Indicator
Buy Entry

- Wait for ROC above 0% – Consider a buy when ROC crosses above 0% on the 1-hour EUR/USD chart, showing improving upside momentum.
- Confirm a support bounce – Buy GBP/USD after a bullish rejection from support and ROC rises above +0.10%; avoid entries if support breaks by 15+ pips.
- Use bullish divergence – Look for price making a lower low while ROC forms a higher low on H1; enter only after a bullish candle closes.
- Trade strong breakouts – Buy after EUR/USD breaks resistance by 10–15 pips and ROC reaches +0.30% or higher on H1.
- Check the 4-hour trend – Prefer H1 buy signals when the 4-hour structure shows higher highs and higher lows.
- Avoid stretched entries – Don’t buy after a 40–50 pip one-candle surge; wait for a pullback toward the breakout area.
- Set a logical stop-loss – Place the stop 15–25 pips below the recent H1 swing low, depending on pair volatility.
- Target at least 1:2 RR – If the stop is 20 pips, aim for roughly 40 pips or more; skip trades offering less reward.
Sell Entry

- Wait for ROC below 0% – Consider a sell when ROC crosses below 0% on the 1-hour GBP/USD chart, confirming weakening momentum.
- Confirm resistance rejection – Sell after price rejects resistance and ROC falls below -0.10%; avoid the setup if price breaks resistance by 15+ pips.
- Watch bearish divergence – Look for a higher price high while ROC forms a lower high on H1; wait for bearish candle confirmation.
- Trade confirmed breakdowns – Sell EUR/USD after support breaks by 10–15 pips and ROC drops below -0.30%.
- Follow the 4-hour trend – Give more weight to H1 sell signals when the 4-hour chart shows lower highs and lower lows.
- Don’t chase sharp drops – Avoid selling after a 40–50 pip candle; wait for a controlled pullback toward broken support.
- Protect the position – Place the stop 15–25 pips above the latest H1 swing high, adjusting for volatility.
- Demand 1:2 risk-reward – With a 25-pip stop, look for at least a 50-pip target; skip weak setups with limited downside.
Final Thoughts on the MT4 Rate of Change Indicator
The MT4 Rate of Change Indicator is most useful when traders treat it as a momentum confirmation tool. It shows how much price has changed over a chosen number of periods, making it easier to spot strengthening momentum, weakening moves, and possible divergences.
Three practical points stand out: use ROC with price structure, adjust the period to the trading timeframe, and wait for confirmation around important support or resistance. Traders should also test settings on each currency pair instead of assuming one configuration works everywhere.
The indicator can improve timing, but it cannot predict every reversal or breakout. Trading forex carries substantial risk. No indicator guarantees profits. A sensible next step is to test ROC on historical EUR/USD and GBP/USD charts, record the results over at least 50–100 setups, and see which combinations of momentum, structure, and risk management actually perform consistently.
Recommended MT4/MT5 Broker
XM Broker
- *FREE $50 To Start Trading Instantly! (Withdraw-able Profit)
- Deposit Bonus up to $5,000
- Unlimited Loyalty Program
- Award Winning Forex Broker
- Additional Exclusive Bonuses Throughout The Year

>> Sign Up for XM Broker Account here <<


