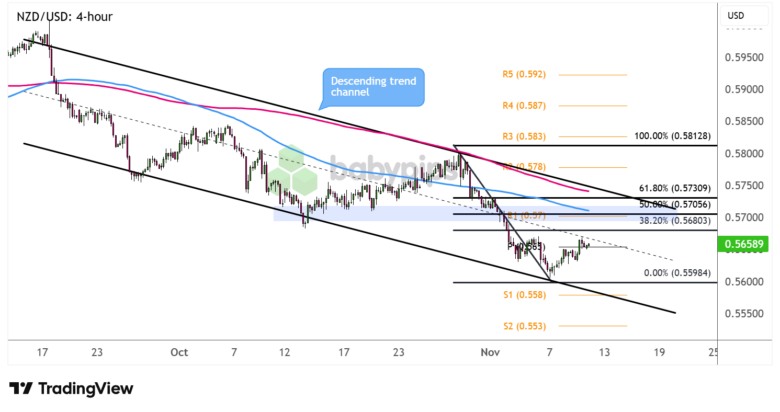
NZD/USD has formed lower highs and lower lows within a descending channel on its 4-hour time frame.
Are sellers just waiting to hop in on another resistance test?
Take a look at this area of interest spanned by the Fibonacci retracement levels!
NZD/USD 4-hour Forex Chart by TradingView
Strengthening RBNZ rate cut expectations, highlighted by disappointing quarterly labor market data from New Zealand, appear to be dragging the Kiwi further south as the central bank decision draws closer.
At the same time, the U.S. dollar has found support from Powell’s less dovish FOMC presser and the possibility of the government shutdown ending soon.
Does this mean the trend is still our friend on NZD/USD?
Remember that directional biases and volatility conditions in market price are typically driven by fundamentals. If you haven’t yet done your fundie homework on the New Zealand dollar and the U.S. dollar, then it’s time to check out the economic calendar and stay updated on daily fundamental news!
The pair is in pullback mode after bouncing off the descending channel support near the .5600 major psychological mark. Price is closing in on the 38.2% Fibonacci retracement level around the mid-channel area of interest, which could be enough to hold as a near-term ceiling.
A larger correction could still reach the 50% Fib that’s in line with the .5700 handle, a former support zone, and the 100 SMA dynamic inflection point. But if NZD/USD keeps advancing, the 61.8% Fib could serve as the line in the sand for a bearish pullback closer to the channel resistance.
Keep your eyes peeled for reversal candlesticks at these areas, as a return in selling pressure could drag NZD/USD back down to the swing low or the channel support near S1 (.5580).
On the other hand, long green candlesticks closing above the channel top could send the pair to the next upside barrier at R2 (.5780) and beyond.
Whichever bias you end up trading, don’t forget to practice proper risk management and stay aware of top-tier catalysts that could influence overall market sentiment.
Disclaimer:
Please be aware that the technical analysis content provided herein is for informational and educational purposes only. It should not be construed as trading advice or a suggestion of any specific directional bias. Technical analysis is just one aspect of a comprehensive trading strategy. The technical setups discussed are intended to highlight potential areas of interest that other traders may be observing. Ultimately, all trading decisions, risk management strategies, and their resulting outcomes are the sole responsibility of each individual trader. Please trade responsibly.


