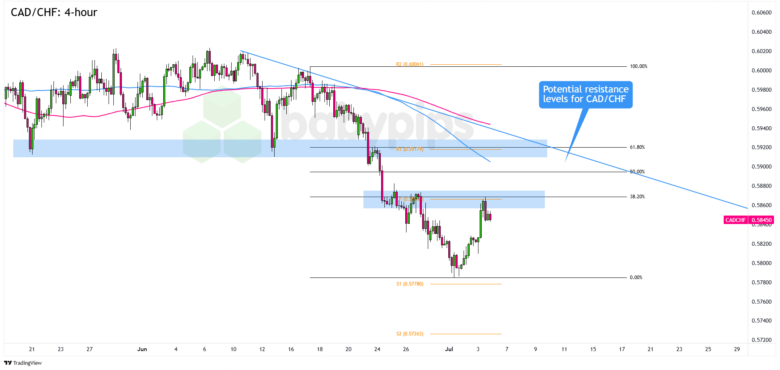
CAD/CHF just bounced off fresh 2025 lows, but nearby resistance levels could make life tough for the bulls.
Is this a chance to catch the next leg lower in what’s been a steady downtrend?
CAD/CHF 4-hour Forex Chart by TradingView
CAD/CHF has been trending lower since mid-June, printing a series of lower highs and lows as oil prices slipped and trade deal uncertainty between the U.S., Canada, and other global partners weighed on sentiment.
Meanwhile, the Swiss franc gained ground as an alternative to the U.S. dollar. Traders took shelter in the franc while pricing in U.S. fiscal concerns, Fed rate cut talks, and growing doubts about the Fed’s independence.
Remember that directional biases and volatility conditions in market price are typically driven by fundamentals. If you haven’t yet done your homework on the Swiss francand the Canadian dollar, then it’s time to check out the economic calendar and stay updated on daily fundamental news!
CAD/CHF marked fresh 2025 lows earlier this month before finding support at the .5800 psychological handle. The pair has since bounced to around .5850, where it’s now hovering near the Pivot Point line at .5866 and the 38.2% Fibonacci retracement on the 4-hour chart.
If bearish momentum picks up from this zone and red candlesticks start stacking, CAD/CHF could head back toward its .5800 lows, maybe even printing new yearly lows.
On the flip side, if the pair pushes higher, keep an eye on the .5900 to .5920 area. That zone lines up with the R1 Pivot Point at .5918, the 50% Fib, the 100 SMA, and a trend line resistance that’s capped rallies since June.
If CAD/CHF reaches that higher resistance and starts flashing bearish reversal patterns, that could be the sweet spot for sellers looking to ride the longer-term downtrend at a better price.
Whichever bias you end up trading, don’t forget to practice proper risk management and stay aware of top-tier catalysts that could influence overall market sentiment.
Disclaimer:
Please be aware that the technical analysis content provided herein is for informational and educational purposes only. It should not be construed as trading advice or a suggestion of any specific directional bias. Technical analysis is just one aspect of a comprehensive trading strategy. The technical setups discussed are intended to highlight potential areas of interest that other traders may be observing. Ultimately, all trading decisions, risk management strategies, and their resulting outcomes are the sole responsibility of each individual trader. Please trade responsibly.


