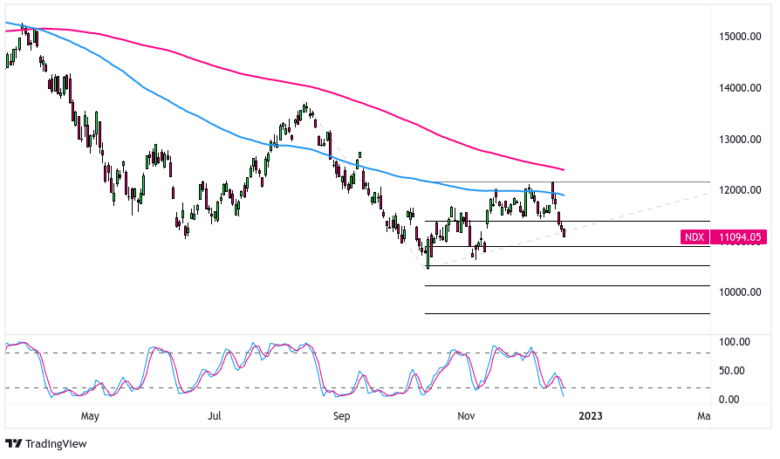
Thanks to last week’s hawkish Fed meeting, U.S. equities markets like the Nasdaq 100 are back in the longer-term downtrend that’s dominated this year.
Will recent swing lows be retested and break? Or will they hold and draw in fresh buyers?
This week we’re revisiting a watchlist post we made back in November, highlighting a potential area of interest in the Nasdaq 100 after a lower-than-expected U.S. CPI number had boosted the market higher.
We noted that NAS100 was nearing the 12,000 major psychological handle, the 100 SMA, and the 50% Fibonacci retracement area from the September downswing, an area traders should watch closely as a potential technical setup. We also noted that the directional bias will likely be dependent on if the Fed’s stance on inflation would change, among other factors.
Since then, the Federal Reserve has stayed hawkish on monetary policy despite months of declining annualized inflation reads in the U.S., arguably more hawkish than market had hoped to see given the data.
Last week, the latest FOMC statement hinted that rate cuts are not likely coming in 2023, and that the Fed Funds target area may be even higher than what the expected back at the September meeting (current Fed expectations are that rates would reach 5.1% by then end of next year).
This event correlated with the dramatic turn in NAS100 last week, after a month of rangebound movement around the previously noted technical area of resistance.
And when using the Fibonacci extension tool and previous price action, we can see on the chart above that the previous swing low around 10,500 may be the first potential support handle. The full potential support area to watch extends down to the 78% Fib extension area of 9,570, where some profit taking may be had by shorts.
We may see a downswing to these levels over the next few weeks if the upcoming core PCE read on Friday (the Fed’s preferred inflation gauge) surprises with a higher-than-expected ( or higher-than-previous) read, supporting the Fed’s hawkish stance further.
On the other hand, a lower-than-expected(previous) core PCE read may spark a bullish reaction from traders, but one that may be short-lived given the hawkish Fed outlook for 2023 that everyone is currently focused on.
That’s the current fundamental and technical picture, which when all put together, favors the longer-term bears at the moment. But with a potential top tier short-term catalyst ahead, it may be a good idea to see that number and the market’s reaction before making a move.
There are so many ways to play the market from there, but arguably one of the top strategies to consider is if core PCE is inline at 0.2% m/m and the market pops higher to the 11,500 to 12,000. Watch that area for bearish resistance patterns before considering a longer-term short play on NAS100.
If that area holds and used as a potential entry area, and if using a break above the 200 SMA as a trade invalidation event, then the potential return-on-risk (R:R) picture is around 1:1. If targeting the previous swing low (around 10,500), or a little over 2:1 if targeting the 78% Fib extension area (around 9,570).
For the bulls, long positions are low probability longer-term plays at the moment, but there is a short-term setup to consider. If the core PCE number comes in well below expectations/previous and the low liquid holiday markets facilitates a strong bullish move, there may be some points to catch there if the market is trading near the previous swing low (around 10,500) at that time of the release.
As always, risk management is up to each individual trader, so be sure to set up your entries, exits, and position sizes according to your own risk tolerances and available risk capital. Never risk more than 1% of total risk capital on any trade!
This content is strictly for informational purposes only and does not constitute as investment advice. Trading any financial market involves risk. Please read our Risk Disclosure to make sure you understand the risks involved.


