


The Accurate Reversal Indicator MT4 aims to solve this timing problem. This tool helps traders identify high-probability reversal zones by combining price action analysis with momentum shifts. Instead of guessing where price might turn, traders get visual signals when multiple reversal conditions align. Let’s examine how this indicator actually works and whether it lives up to its name.
What Is the Accurate Reversal Indicator MT4?
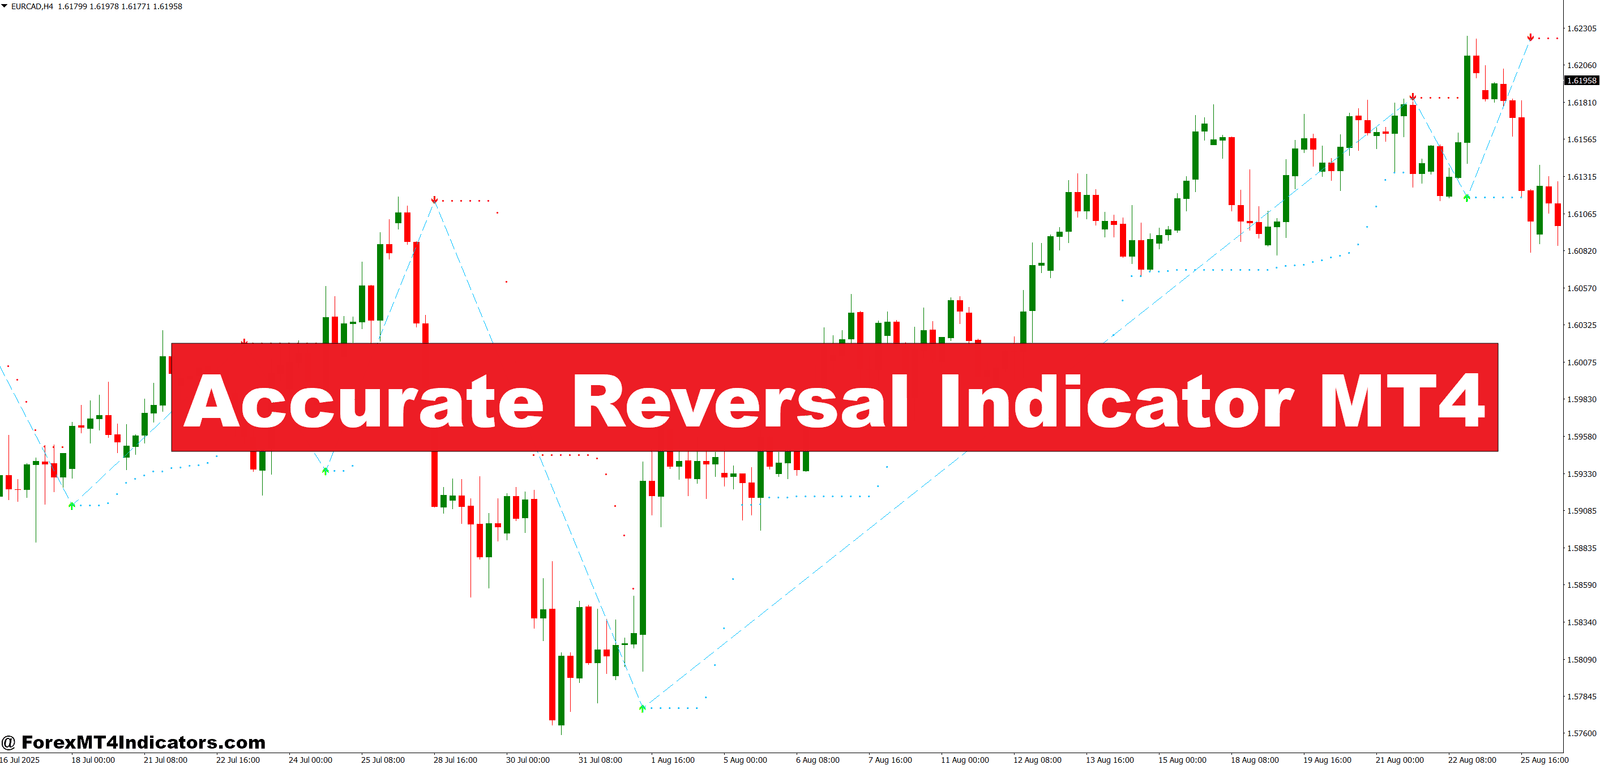
This indicator is a technical analysis tool designed to spot potential trend reversals on MetaTrader 4 charts. It plots arrows or dots on the chart when it detects a shift in market momentum that suggests price might change direction.
The indicator doesn’t just look at one factor. It analyzes the relationship between recent price highs and lows, checks momentum oscillations, and measures the strength of the current trend. When these elements align in a specific way, the indicator generates a signal.
Most reversal indicators on MT4 rely solely on overbought or oversold conditions. This one takes a different approach. It waits for confirmation from multiple technical factors before flagging a potential reversal. That means fewer signals overall, but the ones that appear tend to carry more weight.
How the Indicator Calculates Reversal Signals

The calculation process involves several steps that run simultaneously on each new candle. First, the indicator measures the distance between recent swing highs and lows. This gives it a baseline for normal price movement in the current market condition.
Next, it tracks momentum using a modified oscillator formula. When momentum starts diverging from price movement—like when price makes a new high but the oscillator doesn’t—the indicator flags this as a warning sign. This divergence often precedes reversals.
The final component checks for exhaustion patterns. It looks at the size and frequency of candles in the prevailing trend. When it detects unusually large candles or a cluster of consecutive candles in one direction, it interprets this as a potential exhaustion point.
All three factors must align within a specified number of candles for a signal to appear. If price shows momentum divergence AND exhaustion patterns AND exceeds the normal swing range, an arrow plots on the chart. This multi-factor approach reduces false signals compared to single-indicator systems.
Practical Application in Real Trading Scenarios
Here’s how it works in practice. On a GBP/USD 4-hour chart during the Asian session, price had been climbing for two days straight. The indicator plotted a red arrow above the most recent candle at the 1.2850 level. This signaled a potential bearish reversal.
A trader watching this setup would wait for the next candle to confirm. If that candle closed below the signal candle’s low, it validated the reversal warning. In this case, price dropped 120 pips over the next 24 hours, reaching 1.2730. The early warning gave traders a chance to either exit long positions or prepare short entries.
But the indicator doesn’t catch every reversal. During the London open on that same pair, it gave a bullish signal at 1.2780. Price rallied for 30 pips, then collapsed through the signal level and continued lower. The signal failed because it appeared during a news event that created unusual volatility.
That’s a crucial lesson. This tool performs best in normal market conditions. When major economic data releases hit, or when central banks make announcements, the usual technical patterns break down. Traders need to check the economic calendar before acting on any reversal signal.
For day traders, the indicator works well on 15-minute and 1-hour charts. Swing traders get better results on 4-hour and daily timeframes. The 5-minute chart generates too many signals, creating noise rather than clarity.
Accurate Reversal Indicator MT4 Customizing Settings

The default settings work for most currency pairs, but adjustments can improve performance. The sensitivity parameter controls how strict the reversal criteria are. A lower number (around 3-5) produces more signals but includes more fake-outs. A higher number (8-12) gives fewer but more reliable signals.
For trending pairs like USD/JPY, increase the sensitivity to 10. This pair often makes extended runs in one direction, so you want the indicator to wait for stronger reversal evidence. For range-bound pairs like EUR/CHF, a sensitivity of 5-6 works better since reversals happen more frequently.
The lookback period determines how many candles the indicator analyzes. The default is usually 20-25 candles. Shorter timeframes benefit from a smaller lookback (15-18 candles) because price patterns develop faster. Longer timeframes can use a larger lookback (30-40 candles) to capture bigger picture trends.
Some versions let you adjust the arrow placement. Placing arrows slightly away from price makes the chart cleaner and easier to read. But don’t move them too far—you need to see exactly where the signal triggered.
Alert settings matter too. Enable popup alerts for your primary trading timeframe. Turn off alerts for timeframes you’re not actively trading. Otherwise, you’ll get bombarded with notifications that distract more than help.
Advantages and Real Limitations
The biggest advantage is its multi-confirmation approach. Single-factor indicators like basic RSI or MACD produce signals constantly. This tool’s filtered signals save time by highlighting only the setups that meet multiple criteria.
It also reduces emotional trading. When you have clear visual signals, you’re less likely to jump into random setups based on gut feeling. The indicator either shows a signal or it doesn’t. That binary output helps maintain discipline.
The visual simplicity helps too. Arrows are easier to interpret than complex oscillators with multiple lines. New traders can understand what the indicator is suggesting without a PhD in technical analysis.
Now for the limitations, and they’re important. No reversal indicator catches tops and bottoms perfectly. This one sometimes signals early, meaning price might continue in the original direction for another 20-30 pips before actually reversing. That can stop out traders who enter immediately at the signal.
It also suffers during ranging markets. When price chops sideways, the indicator generates signals at both ends of the range. These aren’t true reversals—just normal oscillations within the range. Traders need to identify the overall market structure before using reversal signals.
The indicator lags during extremely fast moves. If price gaps or makes a sudden vertical move, the indicator needs several candles to catch up. By the time it plots a signal, the reversal might already be halfway complete.
One more thing: it doesn’t predict reversals, it identifies them as they develop. That’s a subtle but critical distinction. You’re not getting advance warning; you’re getting confirmation that a reversal is potentially underway. The trade setup still requires price action confirmation before entry.
How It Compares to Similar Reversal Tools
The Zigzag indicator is another popular reversal tool. It connects swing highs and lows with lines, showing the overall trend structure. But Zigzag repaints—it changes past signals as new price data comes in. The Accurate Reversal Indicator doesn’t repaint, which makes it more reliable for backtesting and live trading.
Parabolic SAR is a classic reversal indicator that plots dots above or below price. When the dots flip from one side to the other, it signals a potential reversal. The problem is SAR triggers constantly in choppy markets, creating whipsaw losses. The Accurate Reversal Indicator filters out more of this chop through its multi-factor confirmation process.
Traditional divergence trading requires manually spotting differences between price and oscillators like RSI or MACD. That takes time and practice. This indicator automates part of that divergence detection, though it doesn’t replace full manual analysis.
Stochastic oscillators signal reversals when they cross in overbought or oversold zones. These signals happen frequently—sometimes several times per day on a single pair. The Accurate Reversal Indicator is more selective, waiting for additional confirmation beyond just overbought/oversold readings.
Using the Indicator Within a Complete Strategy

This indicator works best as one component of a broader trading system. Smart traders combine it with support and resistance analysis. When a reversal signal appears near a major support or resistance level, the probability increases.
Trend analysis provides context. If the higher timeframe shows a strong uptrend, be skeptical of bearish reversal signals on lower timeframes. Those counter-trend signals fail more often. Focus on reversal signals that align with the higher timeframe direction.
Adding a simple 200-period moving average helps too. Reversal signals that occur with price near this moving average tend to be more reliable. The moving average acts as a magnet—price often reverses when it reaches this level.
Risk management matters more than the indicator itself. Even the best reversal signals fail 30-40% of the time. Position sizing and stop placement determine long-term success. Place stops beyond the recent swing high or low, giving the trade room to breathe. Target at least a 2:1 reward-to-risk ratio.
Trading forex carries substantial risk. No indicator guarantees profits, and past performance doesn’t predict future results. Markets can remain irrational longer than you can remain solvent, especially when using leverage.
How to Trade with Accurate Reversal Indicator MT4
Buy Entry

- Wait for the blue/green arrow below price – Don’t enter immediately when the signal appears; wait for the next candle to close above the signal candle’s high to confirm the reversal is gaining momentum.
- Check the 4-hour chart context – Only take buy signals on the 1-hour or 15-minute charts if the 4-hour timeframe shows price above the 200 EMA or in an established uptrend.
- Place stops 5-10 pips below the signal candle low – This protects you if the reversal fails while giving the trade enough room to develop, especially on volatile pairs like GBP/USD.
- Avoid buy signals during major news releases – Skip any signals that appear 30 minutes before or after high-impact economic data like NFP or central bank decisions, as these create unpredictable price spikes.
- Look for buy signals at support zones – The strongest buy setups occur when the indicator fires near daily or weekly support levels, horizontal support, or previous swing lows on EUR/USD.
- Target 1.5:1 minimum reward-to-risk – If your stop is 30 pips, aim for at least 45 pips profit; tighten this to 1:1 during the Asian session when price moves slower.
- Skip buy signals in tight ranges – If price has been oscillating in a 40-50 pip range on the 1-hour chart for several hours, the reversal signal is likely just range noise, not a true trend change.
- Reduce position size by 50% after two losing trades – If the indicator gives two failed buy signals in a row on the same pair, cut your risk in half on the next signal to protect your account during choppy conditions.
Sell Entry

- Wait for the red arrow above price – Let the following candle close below the signal candle’s low before entering short; this confirms sellers are in control and the reversal has momentum.
- Verify daily chart shows downtrend or resistance rejection – Only trade sell signals on lower timeframes when the daily chart confirms bearish structure or price is hitting major resistance.
- Set stops 5-10 pips above the signal candle high – Position your stop loss just beyond the reversal point to avoid getting stopped by small retracements, adding extra buffer for GBP/JPY’s volatility.
- Ignore sell signals during the first hour of London open – Price action from 8:00-9:00 AM GMT often creates false reversals due to liquidity surges; wait until the session stabilizes.
- Prioritize sell signals at resistance levels – The best short setups happen when the red arrow appears at previous swing highs, round numbers (like 1.3000 on EUR/USD), or daily resistance zones.
- Trail stops to breakeven after 20-30 pips profit – Once your sell trade moves 20-30 pips in your favor, move your stop to entry to eliminate risk, especially on 4-hour chart trades.
- Skip sell signals when RSI is below 30 – If the 14-period RSI shows oversold conditions (under 30) when the sell signal appears, price is likely to bounce rather than continue lower.
- Don’t trade sell signals on Friday afternoons – Avoid any reversal signals after 12:00 PM EST on Fridays as liquidity dries up and weekend gap risk increases significantly.
Final Thoughts on This Reversal Tool
The Accurate Reversal Indicator MT4 offers a systematic way to identify potential turning points in the forex market. Its strength lies in combining multiple technical factors into a single visual signal, reducing the noise that comes from using individual indicators alone. Traders get clear entry suggestions without analyzing multiple charts and oscillators simultaneously.
That said, it’s not a standalone solution. The indicator’s effectiveness depends on proper market context, confirmation from price action, and integration with sound risk management. Signals during high-impact news events or in choppy range-bound conditions often fail. Successful traders use this tool as a starting point for analysis, not as their only decision-making criteria.
Test it on a demo account first. Watch how signals perform on your preferred pairs and timeframes. Pay attention to which setups work and which don’t. That hands-on experience reveals more than any article can. The indicator might fit perfectly into your trading approach, or you might find it generates too many signals for your style. Either way, you’ll know based on actual results rather than marketing claims.
Recommended MT4/MT5 Broker
XM Broker
- Free $50 To Start Trading Instantly! (Withdraw-able Profit)
- Deposit Bonus up to $5,000
- Unlimited Loyalty Program
- Award Winning Forex Broker
- Additional Exclusive Bonuses Throughout The Year
- Exclusive 90% VIP Cash Rebates for all Trades!


Already an XM client but missing out on cashback? Open New Real Account and Enter this Partner Code: VIP90


