


The ADX DMI indicator for MT5 exists to solve exactly that problem. It doesn’t predict where price will go. What it does is tell traders whether a trend is actually in play — and that distinction alone can save a trading account from death by a thousand choppy trades. The ADX DMI indicator MT5 combines two separate but related tools into one, and understanding how each component behaves is what separates traders who use it well from those who don’t.
What the ADX DMI Indicator Actually Is

ADX stands for Average Directional Index. DMI stands for Directional Movement Index. Both were developed by J. Welles Wilder and introduced in his 1978 book. They’re technically different measurements, but they work together as a single system.
The DMI produces two lines: the +DI and the -DI. The +DI measures upward price movement, and the -DI measures downward movement. When +DI is above -DI, buyers are in control. When -DI is above +DI, sellers dominate. That crossover is the directional signal.
The ADX line is calculated as a smoothed average of the difference between those two DI values. It doesn’t show direction — it measures the strength of whatever trend is in motion. An ADX reading below 20 typically signals a weak or ranging market. Readings between 25 and 50 indicate a developing trend. Above 50, the trend is strong, though that territory can also signal exhaustion is approaching.
How the Calculation Works
Wilder built the ADX from what he called True Range and Directional Movement. Directional Movement (+DM and -DM) captures how much of each candle’s range extends beyond the previous candle’s range, either upward or downward.
The smoothed values of +DM and -DM are divided by the Average True Range to normalize them, producing the +DI and -DI percentages. From there, the Directional Index (DX) is calculated by dividing the absolute difference of the two DI lines by their sum. The ADX is then a 14-period (by default) smoothed average of DX values.
What matters practically is that the ADX lags. It reflects what has already happened, not what’s about to happen. Traders who treat it as a leading signal tend to get burned. Used correctly — as a filter — it holds real value.
Applying the ADX DMI Indicator on MT5
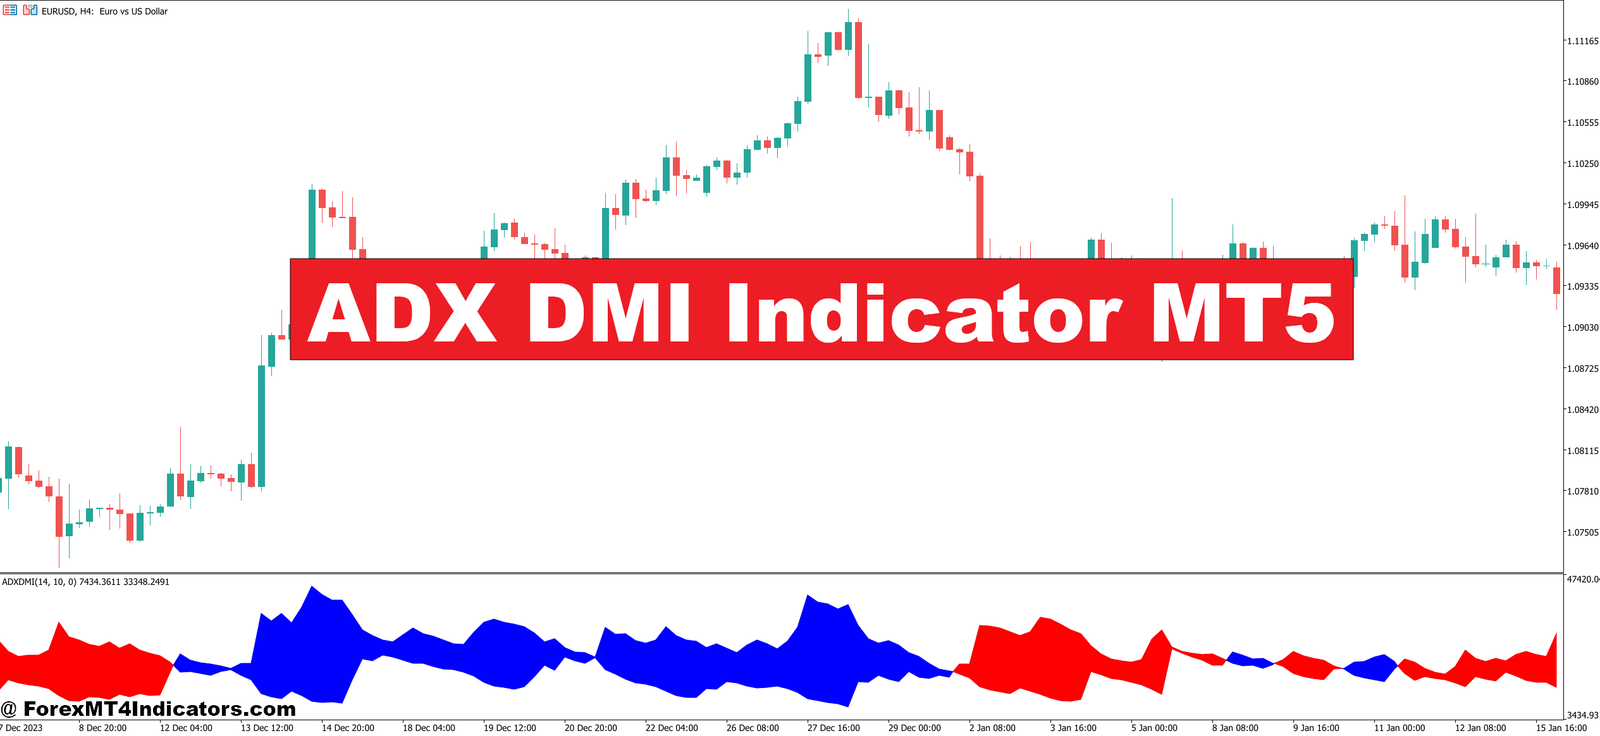
Here’s where things get practical. When testing this on EUR/USD using a 1-hour chart during a trending week, the setup becomes clear. Say it’s a Tuesday after a strong Monday move. The +DI crossed above -DI on Monday afternoon, and by Tuesday morning, ADX has climbed from 18 to 31. That rising ADX combined with the +DI dominance tells traders the uptrend has momentum behind it — not just a random spike.
A pullback to a key support level in that environment becomes a high-probability entry, not just a guess. But during the range-bound consolidation that followed — where ADX dropped back under 20 — those same pullback setups fail constantly. The indicator makes that distinction visible.
On the GBP/USD 4-hour chart, the ADX DMI works well for filtering out NFP day noise. On high-impact news days, the DI lines tend to whipsaw, crossing back and forth rapidly. ADX often stays flat or dips during that chaos. Traders who wait for ADX to rise above 25 after the initial volatility spike often catch the sustained post-news trend, rather than getting chopped up in the initial moves.
ADX DMI Indicator MT5 Settings and Customization

MT5 allows full parameter control. The default period is 14, which works well on daily and 4-hour charts. Shorter periods — like 7 or 10 — make the indicator more reactive, useful on 15-minute charts but prone to more false signals. Longer periods, like 20 or 21, smooth everything out and suit swing traders working on daily timeframes.
Color customization matters too. Most traders keep +DI green and -DI red by default, but changing the ADX line to a bold color like orange makes it much easier to read at a glance, especially on busy charts.
Honest Strengths and Real Limitations
The ADX DMI’s biggest strength is objectivity. It removes the guesswork about whether a market is trending. When ADX is above 25 and rising, traders have a measurable basis for taking directional trades. That clarity is valuable, especially for newer traders who struggle to read raw price action.
It also pairs well with other tools. Many traders combine it with a 20 or 50-period moving average — when price is above the MA, the trend is up, and they only take long signals when +DI leads and ADX confirms strength. That two-filter approach reduces a lot of low-quality setups.
That said, the indicator has clear weaknesses. The lag is real. By the time ADX climbs above 25 on some trades, a significant portion of the move has already happened. In fast markets — like during a central bank announcement — the signal arrives late, and entries at that point carry higher risk.
It also doesn’t perform well in ranging markets, which is actually the point. But traders sometimes misread a high ADX reading as a permanent condition. ADX above 50 can and does reverse quickly. And the DI crossovers in choppy conditions are essentially noise — waiting for the ADX level to confirm the crossover is critical, not optional.
ADX DMI vs Similar Indicators

Compared to RSI, the ADX DMI tells traders something completely different. RSI measures overbought and oversold conditions. ADX measures trend strength. Using them together fills in gaps neither covers alone.
Compared to MACD, the ADX DMI has less sensitivity to short-term momentum shifts but gives a cleaner read on whether a trend has enough strength to sustain a position. Many trend-following traders prefer ADX over MACD specifically because it doesn’t generate as many whipsaw signals in slow-moving markets.
How to Trade with ADX DMI Indicator MT5
Buy Entry

- +DI crosses above -DI – Enter long when +DI moves above -DI on the 1-hour or 4-hour chart, confirming buyers are taking control of price direction.
- ADX rises above 25 – Only take the buy signal when ADX is climbing, not flat, confirming the uptrend has real momentum behind it.
- ADX was below 20 before the crossover – A fresh trend starting from low ADX territory produces the cleanest buy setups on EUR/USD and GBP/USD.
- Price holds above the 50 EMA – Confirm the buy by checking price sits above the 50-period EMA on the same timeframe before entering.
- Place stop-loss 10-15 pips below the recent swing low – Protect the trade structurally, not based on arbitrary pip counts.
- Target 2:1 reward-to-risk minimum – On 4-hour EUR/USD setups, aim for at least 40 pips profit when risking 20 pips.
- Avoid buying when ADX is above 50 – Late-trend entries carry reversal risk; the move is likely exhausted by that point.
- Skip signals on NFP or major news days – DI crossovers during high-impact events are mostly noise and produce false entries.
Sell Entry

- -DI crosses above +DI – Enter short when -DI takes the lead on the 1-hour or 4-hour chart, signaling sellers are now driving price.
- ADX confirms with a rising slope – A -DI crossover with flat ADX below 20 is a fake-out; wait for ADX to actually turn upward before entering.
- Price breaks below a key support level – The -DI crossover carries more weight when price simultaneously breaks a visible support on GBP/USD or EUR/USD.
- ADX reading between 25-45 gives the best short setups – This range signals a healthy downtrend without the exhaustion risk that comes above 50.
- Enter at the close of the signal candle – Don’t anticipate the crossover mid-candle; wait for the candle to close and confirm the DI position.
- Set stop-loss 10-15 pips above the swing high – Structure-based stops outperform fixed-pip stops in trending conditions.
- Trail stop once ADX exceeds 35 – Lock in profits as the trend strengthens; move the stop to breakeven after price moves 20 pips in your favor.
- Don’t short when -DI and +DI are within 5 points of each other – Tight DI separation signals indecision, and trades taken there get chopped out regularly.
Final Thoughts
The ADX DMI indicator for MT5 is a genuinely useful tool when traders understand what it measures and what it doesn’t. It identifies trend strength, filters out ranging conditions, and helps traders stay out of low-probability setups. Used as a filter alongside price action or a moving average system, it improves trade selection. Used blindly or as a standalone signal generator, it disappoints like any other tool.
Trading forex carries substantial risk. No indicator guarantees profits, and past performance in any market condition doesn’t ensure future results. Risk management always comes first. The ADX DMI helps traders pick better spots — but proper position sizing and stop placement determine whether the account survives long enough to benefit from those better spots.
Recommended MT4/MT5 Broker
XM Broker
- Free $50 To Start Trading Instantly! (Withdraw-able Profit)
- Deposit Bonus up to $5,000
- Unlimited Loyalty Program
- Award Winning Forex Broker
- Additional Exclusive Bonuses Throughout The Year
- Exclusive 90% VIP Cash Rebates for all Trades!


Already an XM client but missing out on cashback? Open New Real Account and Enter this Partner Code: VIP90


