


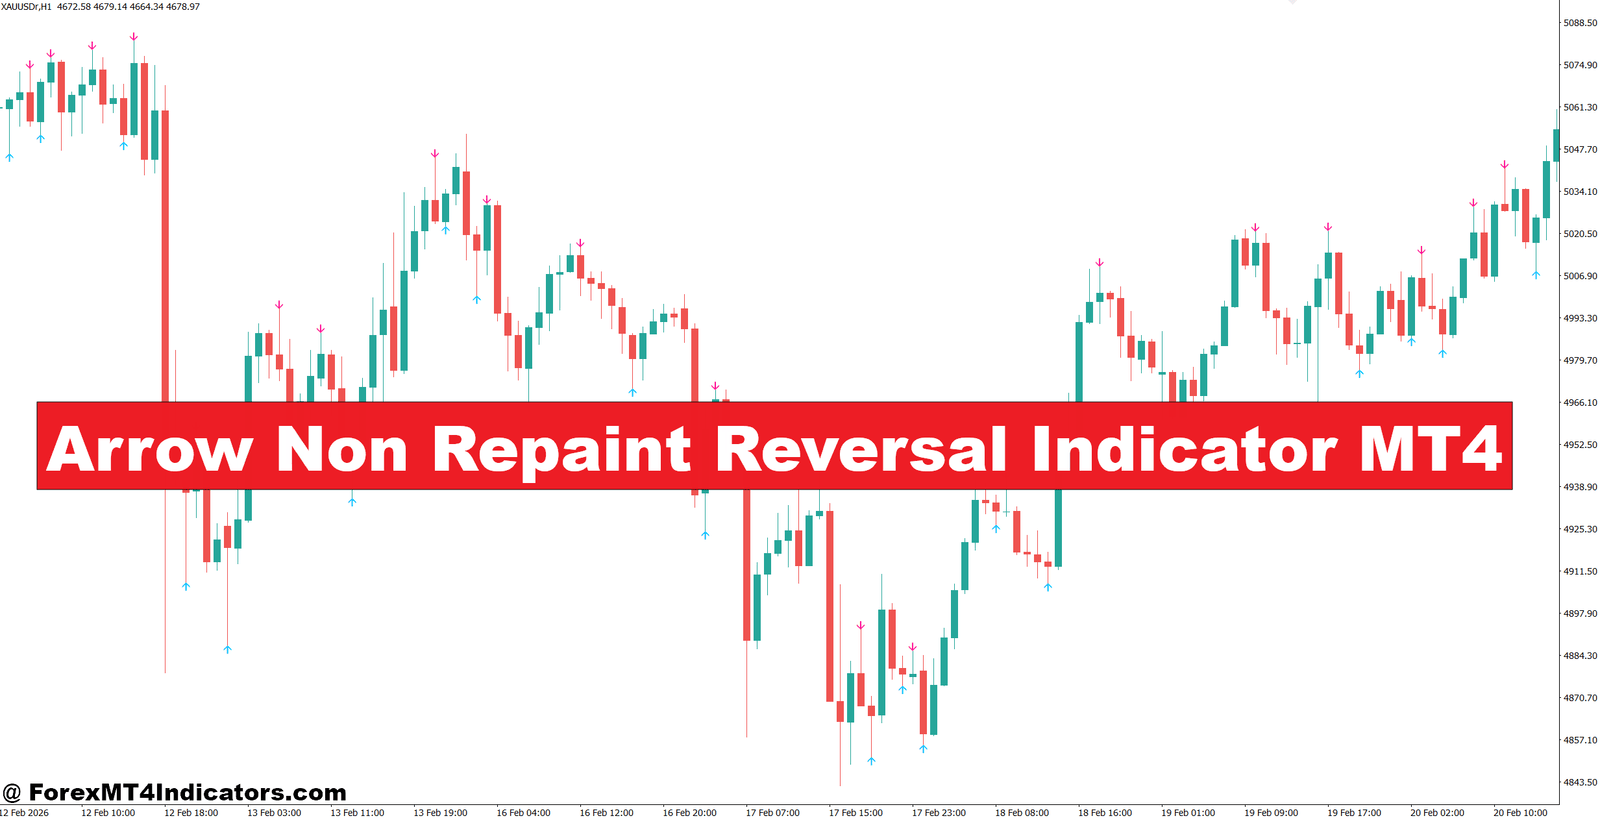
The Arrow Non Repaint Reversal Indicator MT4 was designed to reduce that problem by highlighting potential reversal areas with arrows that stay fixed once the signal is confirmed. Instead of changing historical signals after new candles appear, it keeps previous signals intact, making backtesting much more reliable. Traders still need to confirm each setup with market structure and risk management, but this tool can simplify the process of spotting high-probability reversals. The sections below explain how it works, where it performs best, and how traders can use it more effectively in real market conditions.
What Is the Arrow Non Repaint Reversal Indicator MT4?
The Arrow Non Repaint Reversal Indicator MT4 is a technical analysis tool that identifies potential trend reversal points by placing buy and sell arrows directly on the price chart. Unlike repainting indicators, it doesn’t move or remove past arrows after a candle closes. This gives traders a more realistic view of historical performance.
Most versions combine several market conditions before printing an arrow. These may include:
- Momentum changes
- Price swing highs and lows
- Moving average direction
- Volatility filters
- Candle confirmation
Because different developers create their own versions, the exact formula can vary. Even so, the main goal remains the same: identify areas where buying or selling pressure may be shifting.
The indicator works best when traders combine it with support and resistance, trend analysis, or confirmation from another momentum indicator rather than treating every arrow as an automatic trade signal.
How the Indicator Detects Reversal Opportunities
Instead of reacting to every small price fluctuation, the Arrow Non Repaint Reversal Indicator MT4 usually waits until several technical conditions align before generating a signal.
For example, a buy arrow may appear when:
- Price forms a new swing low.
- Selling momentum starts fading.
- A bullish candle closes above recent bearish pressure.
- Internal filters confirm the reversal.
A sell arrow follows the opposite process after buying pressure weakens.
What makes this useful? Since the indicator doesn’t repaint after candle close, traders can review historical charts without seeing misleading signals that never actually existed during live trading.
During testing on GBP/USD 1-hour charts, traders often notice that quality signals appear less frequently than repainting systems. That isn’t necessarily a weakness. Fewer signals usually mean stronger filtering, helping traders avoid many fake-outs during sideways markets.
Still, no algorithm can predict every reversal correctly. Strong news events can invalidate even well-formed technical setups within minutes.
Using the Indicator in Real Trading Situations

The strongest results usually come when the indicator becomes part of a complete trading plan instead of the entire strategy.
Imagine EUR/USD trading above the 200-period Exponential Moving Average on the 1-hour chart. Price pulls back nearly 45 pips toward a previous support zone before printing a bullish engulfing candle. Shortly afterward, the indicator displays a buy arrow.
That setup offers several reasons to consider a trade:
- Overall trend remains bullish.
- Price reacts from established support.
- Bullish candlestick confirms buying pressure.
- Arrow provides additional confirmation.
A trader could place the stop-loss 20 to 25 pips below the recent swing low while targeting 40 to 60 pips near the previous resistance level. This creates a risk-to-reward ratio close to 1:2.
Now consider USD/JPY during the Asian session. Price moves sideways inside a narrow 25-pip range while the indicator produces several alternating arrows. This is classic market chop. Experienced traders usually avoid these signals because the market lacks directional momentum.
When testing this indicator during volatile Non-Farm Payroll (NFP) releases, many traders notice that early arrows can fail as price rapidly changes direction. Waiting 15 to 30 minutes after major news often produces cleaner setups with lower volatility.
Trading forex carries substantial risk. No indicator guarantees profits.
Best Settings and Practical Adjustments
Most versions of the Arrow Non Repaint Reversal Indicator MT4 work well with their default settings, but small adjustments can improve performance across different markets.
Scalping
- Timeframe: M5 or M15
- Currency pairs: EUR/USD, GBP/USD
- Confirm with a 50 EMA
- Target 10-20 pips
Fast markets produce more arrows, so confirmation becomes even more important.
Intraday Trading
Many traders prefer:
- H1 timeframe
- ATR filter enabled
- Trend confirmation using a 100 EMA
- Profit target between 30 and 70 pips
This balance helps reduce unnecessary entries while capturing meaningful price swings.
Swing Trading
For H4 and Daily charts:
- Leave sensitivity slightly lower.
- Combine with weekly support and resistance.
- Aim for moves exceeding 100 pips when market conditions support larger trends.
Some traders also pair the indicator with the Relative Strength Index (RSI 14). A buy arrow appearing while RSI rises above 30 often carries more weight than an isolated signal.
Strengths, Weaknesses, and Comparison with Similar Indicators
The biggest advantage of the Arrow Non Repaint Reversal Indicator MT4 is consistency. Historical arrows remain exactly where they first appeared, allowing traders to evaluate performance honestly.
Other strengths include:
- Easy visual signals
- Suitable for multiple timeframes
- Helpful for identifying possible reversal zones
- Simple enough for discretionary trading
There are limits, though.
No reversal indicator performs well during every market condition. Sideways price action can generate several losing signals. Strong trends may also continue far longer than expected, causing early reversal entries to fail.
Compared with repainting arrow indicators, this version offers more reliable backtesting because historical signals remain unchanged.
Compared with ZigZag indicators, it reacts earlier but may generate more signals.
Against oscillators like RSI or Stochastic, the Arrow Non Repaint Reversal Indicator MT4 provides visual entry locations instead of overbought and oversold readings. Many experienced traders actually combine both methods for stronger confirmation.
Here’s the thing: market structure still matters more than any single indicator. If price keeps making higher highs and higher lows, traders should think carefully before taking every sell arrow.
How to Trade with Arrow Non Repaint Reversal Indicator MT4
Buy Entry

- Wait for a Buy Arrow – Enter only after the candle closes with a confirmed buy arrow on the 1-hour or 4-hour chart.
- Trade with the Trend – Buy only when price stays above the 200 EMA to improve win probability.
- Confirm at Support – Take buy trades near a strong support zone or previous swing low for better entries.
- Check Momentum – Confirm with RSI above 30 or MACD turning bullish before entering EUR/USD.
- Place a Safe Stop-Loss – Keep the stop-loss 15-30 pips below the recent swing low, depending on volatility.
- Target Strong Resistance – Aim for at least a 1:2 risk-to-reward ratio or 40-80 pips on GBP/USD.
- Avoid High-Impact News – Skip buy signals 15-30 minutes before major events like NFP or FOMC releases.
- Manage Risk – Risk only 1-2% of account equity on each trade, even with strong confirmation.
Sell Entry

- Wait for a Sell Arrow – Open a sell trade only after the signal candle closes on the 1-hour, 4-hour, or Daily chart.
- Follow the Downtrend – Sell only when price remains below the 200 EMA to avoid counter-trend trades.
- Sell from Resistance – Enter near a resistance level or recent swing high for stronger setups.
- Confirm Bearish Momentum – Look for RSI below 70 or a bearish MACD crossover before selling EUR/USD.
- Protect the Trade – Place the stop-loss 15-30 pips above the latest swing high.
- Set Realistic Targets – Take profits at the next support level or target 40-80 pips with a 1:2 risk-to-reward ratio.
- Skip Sideways Markets – Ignore sell arrows when GBP/USD is moving inside a tight 20-30 pip range.
- Control Position Size – Never risk more than 1-2% of your trading capital on a single sell setup.
Final Thoughts
The Arrow Non Repaint Reversal Indicator MT4 gives traders a practical way to spot possible market turning points without the frustration of disappearing historical signals. It performs best when combined with trend direction, support and resistance, and disciplined money management. The key points are straightforward: traders should wait for candle confirmation instead of entering immediately, use higher-timeframe analysis to filter weaker signals, avoid relying on arrows during major news releases or choppy markets, and always manage risk with realistic stop-loss and take-profit levels. Used with patience rather than blind trust, the Arrow Non Repaint Reversal Indicator MT4 can become a valuable part of a structured trading strategy, but sound decision-making will always matter more than any single indicator.
Recommended MT4/MT5 Broker
XM Broker
- *FREE $50 To Start Trading Instantly! (Withdraw-able Profit)
- Deposit Bonus up to $5,000
- Unlimited Loyalty Program
- Award Winning Forex Broker
- Additional Exclusive Bonuses Throughout The Year

>> Sign Up for XM Broker Account here <<


