


AUDUSD chops up and down today
The AUDUSD
AUD/USD
The AUD/USD is the currency pair encompassing the Australian dollar of the Commonwealth of Australia (symbol $, code AUD), and the dollar of the United States of America (symbol $, code USD). The pair’s rate indicates how many US dollars are needed in order to purchase one Australian dollar. For example, when the AUD/USD is trading at 0.7500, it means 1 Australian dollar is equivalent to 0.75 US dollars. The Australian dollar (AUD) is the world’s fifth most traded currency, whilst the US Dollar
The AUD/USD is the currency pair encompassing the Australian dollar of the Commonwealth of Australia (symbol $, code AUD), and the dollar of the United States of America (symbol $, code USD). The pair’s rate indicates how many US dollars are needed in order to purchase one Australian dollar. For example, when the AUD/USD is trading at 0.7500, it means 1 Australian dollar is equivalent to 0.75 US dollars. The Australian dollar (AUD) is the world’s fifth most traded currency, whilst the US Dollar
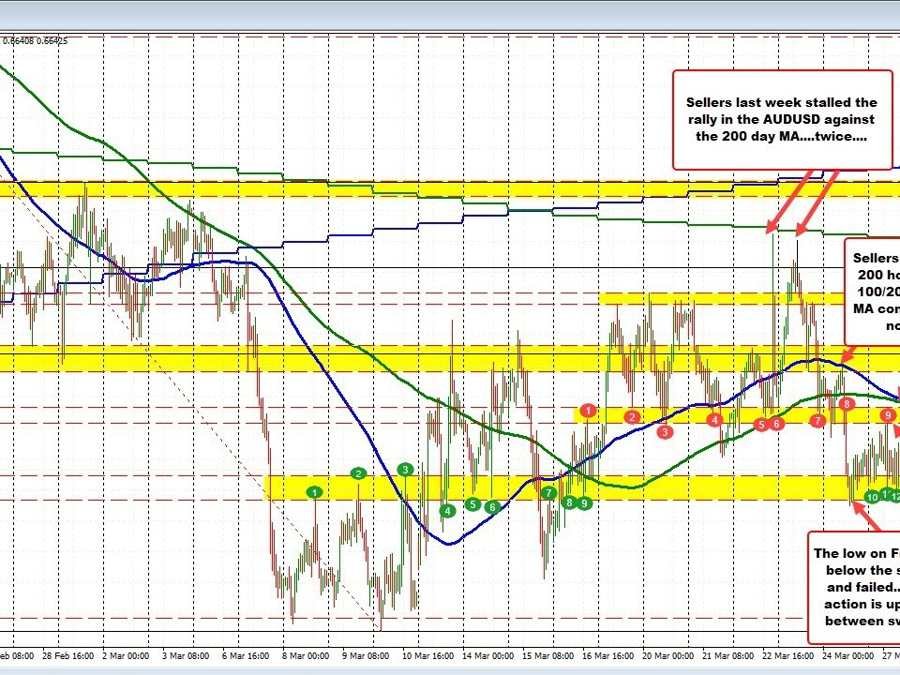
Read this Term has experienced choppy trading today, with price fluctuations occurring between well-defined support and resistance levels. The lower extreme has found support between 0.6628 and 0.66399 (see green numbered circles), while the upper extreme has encountered resistance in a swing area between 0.66656 and 0.6673 (see red numbered circles). Above these levels, the converging 100 and 200-hour moving averages currently sit near 0.6677 (blue and green lines).
On Friday, the price high stalled just below the 100-hour moving average
Moving average
A moving average is a statistical tool that is used to smooth out short-term fluctuations in data and reveal longer-term trends. It is calculated by taking the average of a certain number of data points over a specific period of time, and then plotting that average as a line on a chart. The most common types of moving averages are simple moving averages (SMA) and exponential moving averages (EMA).In financial markets, moving averages are often used to analyze stock prices, exchange rates, and ot
A moving average is a statistical tool that is used to smooth out short-term fluctuations in data and reveal longer-term trends. It is calculated by taking the average of a certain number of data points over a specific period of time, and then plotting that average as a line on a chart. The most common types of moving averages are simple moving averages (SMA) and exponential moving averages (EMA).In financial markets, moving averages are often used to analyze stock prices, exchange rates, and ot
Read this Term (blue line), emphasizing its importance going forward. Currently trading at 0.6640, near the high of the lower swing area, the AUDUSD price action has been choppy not only today but over an extended period, as traders grapple with establishing a clear bullish or bearish bias.
Last week, the high prices stalled against the 200-day moving average on both Wednesday and Thursday. Sellers leaned against this key longer-term moving average, pushing the price lower. As the price is trading below the 100 and 200-hour moving averages, sellers have the upper hand. However, a decisive move below 0.6628 is required to shift the price toward the lower extreme, tested between March 7-13, as well as on March 15 and the start of March 16. The March low reached 0.6563, while the low from March 15 was 0.6589, making these levels potential targets for further selling.


