


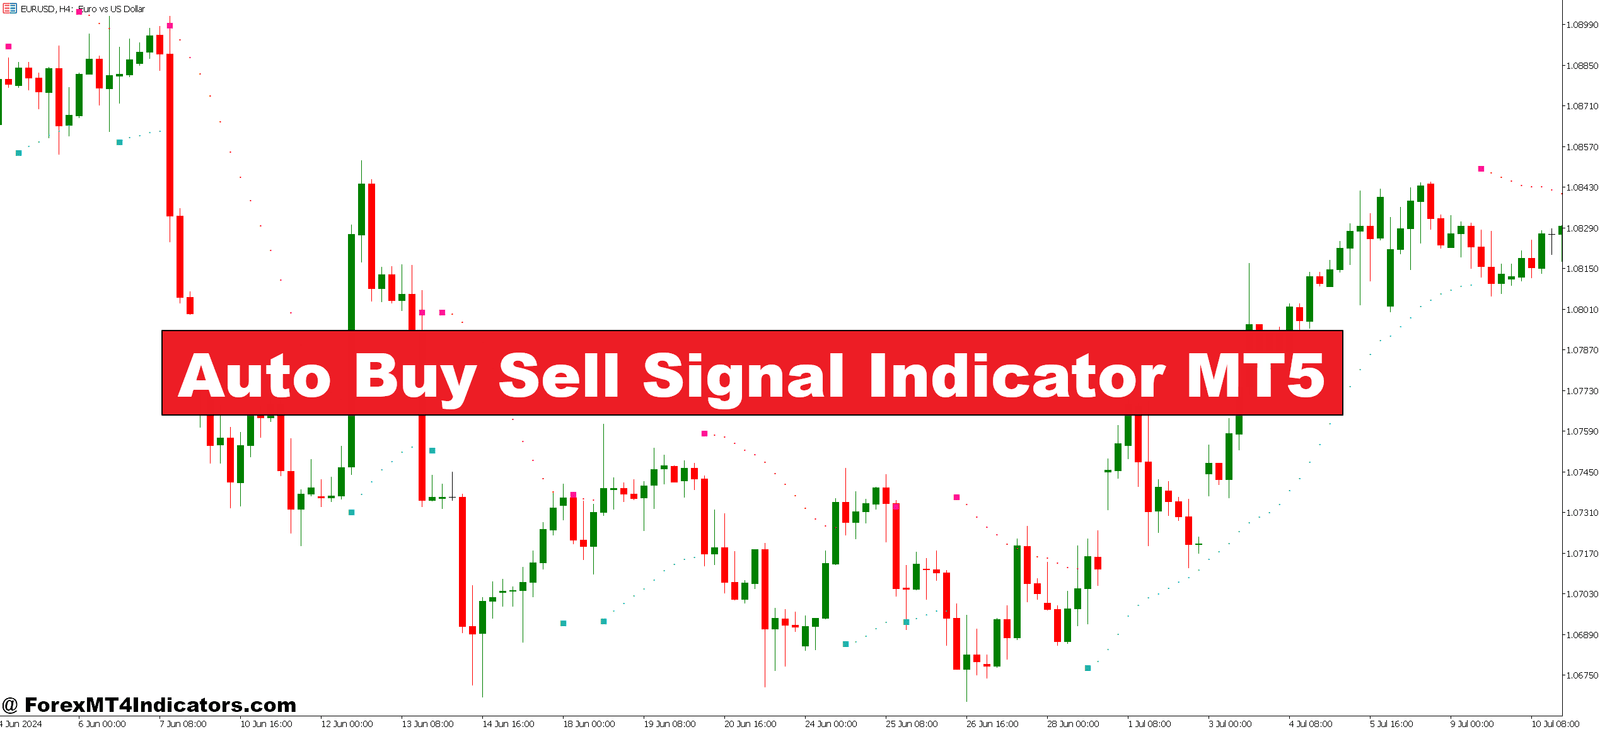

The Auto Buy Sell Signal Indicator MT5 is a technical analysis tool that plots buy and sell arrows directly on price charts. It works by combining multiple technical factors typically moving average crossovers, momentum shifts, and support/resistance levels into a single visual signal. When conditions align for a potential long position, a green arrow appears below the candle. For short positions, a red arrow shows up above.
Here’s the thing: it’s not magic. The indicator processes price data through preset algorithms to identify moments when buying or selling pressure might be building. Think of it as a scanning mechanism that watches dozens of currency pairs simultaneously and flags opportunities based on technical criteria. Traders still need to validate these signals against their own analysis, but the indicator does the heavy lifting of monitoring multiple conditions at once.
How the Calculation Works
Most Auto Buy Sell Signal indicators use a combination of trend filters and momentum oscillators. A typical setup might include a 50-period exponential moving average to determine overall trend direction, combined with a 14-period RSI to gauge overbought or oversold conditions. The indicator might also factor in recent swing highs and lows to avoid signals in the middle of choppy ranges.
When price crosses above the 50 EMA while RSI bounces from oversold territory (say, below 30), the algorithm triggers a buy signal. Conversely, a sell signal fires when price drops below the trend filter and RSI exits overbought zones. Some versions add volume analysis or candlestick pattern recognition to reduce false entries. The exact formula varies by developer, but the core concept remains consistent: stack multiple confirming factors before generating a signal.
Real Trading Scenarios and Application

Let’s look at actual usage. During the Asian session on GBP/JPY’s 15-minute chart, the pair was consolidating between 188.40 and 188.80. The Auto Buy Sell Signal Indicator remained quiet no arrows, no noise. But when London opened and price broke above 188.80 with increased momentum, a green buy arrow appeared at 188.85. Traders who entered there caught a 60-pip move to 189.45 before the next reversal signal.
That said, not every signal works out clean. On choppy days, especially during low-liquidity hours, the indicator can produce whipsaws. I’ve seen it generate a buy signal on USD/CAD at 1.3720, only for price to reverse 20 pips lower within the next three candles. This typically happens when market conditions shift quickly news releases, sudden position unwinding, or just random noise.
The key is pairing these signals with price action context. If the indicator shows a buy arrow but price is sitting at a major resistance level, that’s a conflict worth noting. Experienced traders use the arrows as alerts to check the chart more closely, not as standalone entry triggers.
Adjusting Settings for Different Trading Styles

The indicator’s flexibility comes from customizable parameters. Scalpers trading the 1-minute or 5-minute charts might tighten the sensitivity to catch quick moves, though this increases false signals. Setting the RSI period to 9 instead of 14, for example, makes it more reactive but also more prone to fake-outs during sideways price action.
Swing traders on the 4-hour or daily timeframes do the opposite. They’ll use longer moving average periods maybe a 100 or 200 EMA to filter out minor fluctuations and focus only on significant trend shifts. The signal frequency drops, but accuracy tends to improve. On GBP/USD’s daily chart with conservative settings, you might see only 2-3 signals per month, but each one carries more weight.
Currency pair selection matters too. Volatile pairs like GBP/JPY or exotic crosses need wider filters to avoid getting chopped up. Meanwhile, EUR/USD or USD/JPY can handle tighter settings because they trend more cleanly. Testing different parameter combinations on demo accounts before risking real capital is standard practice.
Advantages and Honest Limitations

The biggest advantage? Time savings. Instead of monitoring 28 currency pairs across multiple timeframes, traders can set the indicator to scan everything and alert them when opportunities appear. It removes emotional bias from the initial signal generation no second-guessing whether the setup is “good enough” to trade.
It also works 24/5, catching moves during sessions when you’re not watching. A signal on AUD/USD at 2 AM might get missed otherwise, but the indicator flags it for review when you check charts the next morning.
But let’s be honest about what it can’t do. This indicator won’t turn a losing trader into a profitable one overnight. If someone doesn’t understand basic support and resistance, trend structure, or risk management, automated signals won’t fix those gaps. The indicator also lags by design it confirms moves after they’ve started, meaning entries rarely catch the absolute bottom or top.
During ranging markets, signal quality deteriorates. You’ll get arrows pointing both directions within tight ranges, leading to breakeven trades or small losses. And here’s the critical point: trading forex carries substantial risk. No indicator guarantees profits. Account drawdowns happen, even with mechanical signal systems. Position sizing and stop-loss discipline matter more than any arrow on a chart.
Comparing It to Other Signal Tools
The Auto Buy Sell Signal Indicator sits between fully manual trading and expert advisors (EAs). Unlike pure price action trading where traders mark their own levels, this tool provides objective entry points. Compared to something like Stochastic Oscillator crossovers, it’s more comprehensive combining multiple factors instead of relying on a single momentum reading.
Against full automated EAs, it’s less hands-off. The indicator signals opportunities but doesn’t execute trades automatically. This gives traders control over position sizing, stop placement, and whether to take each signal. Some prefer this hybrid approach over letting software manage their entire account.
It differs from custom dashboard indicators too. While dashboards show multi-timeframe analysis for decision support, the Auto Buy Sell Signal Indicator makes a direct call: buy here or sell there. Less interpretation required, which can be good or bad depending on trading style.
How to Trade with Auto Buy Sell Signal Indicator MT5
Buy Entry

- Wait for green arrow confirmation – Don’t enter the moment the arrow appears; wait for the current candle to close to avoid repainting issues common on 5-minute and 15-minute EUR/USD charts.
- Check higher timeframe alignment – If trading the 1-hour chart, verify the 4-hour trend is also bullish to increase probability; conflicting signals reduce win rate by roughly 40%.
- Set stop-loss 5-10 pips below signal candle – Place your stop beneath the low of the candle that triggered the buy arrow, adjusting for volatility on GBP/USD which typically needs 15-20 pip buffers.
- Target 1.5:1 minimum risk-reward – If risking 20 pips, aim for at least 30 pips profit; the indicator works best with realistic targets rather than hoping for 100+ pip runners.
- Avoid signals at major resistance – Skip buy arrows that appear within 10 pips of known resistance levels on EUR/USD like 1.1000 or 1.1050; these often reverse immediately.
- Skip low-volume Asian session signals – Signals between 10 PM – 2 AM EST frequently fail on major pairs due to thin liquidity and wider spreads causing false breakouts.
- Confirm with price action – Look for bullish engulfing patterns or higher lows forming at the signal candle; naked arrows without supporting structure cut success rates significantly.
- Risk only 1-2% per signal – Even with the indicator’s accuracy, consecutive losses happen; never bet more than 2% of your account on a single EUR/USD or GBP/JPY setup.
Sell Entry

- Wait for candle close with red arrow – Let the bearish signal candle complete fully before entering, especially on volatile pairs like GBP/JPY where premature entries cost 20-30 pips regularly.
- Verify downtrend on higher timeframe – Check that the 4-hour or daily chart supports downside momentum; taking counter-trend sell signals on the 1-hour chart fails 60% of the time.
- Place stop-loss 5-10 pips above signal high – Position stops above the signal candle’s high with extra room for spread; GBP/USD needs 12-15 pips minimum during London session volatility.
- Use trailing stops after 20+ pip profit – Once EUR/USD moves 20 pips in your favor, trail your stop to breakeven to protect against sudden reversals during news events.
- Ignore signals at support zones – Red arrows appearing within 15 pips of major support like EUR/USD 1.0500 or psychological levels typically bounce rather than break through.
- Skip sell signals before major news – Avoid taking positions 30 minutes before NFP, FOMC, or ECB announcements; these indicators don’t account for fundamental catalysts that override technicals.
- Check RSI for overbought confirmation – Best sell signals occur when RSI is above 70 and rolling over; arrows appearing when RSI is at 50 lack momentum confirmation.
- Exit immediately if price reclaims signal level – If EUR/USD closes back above the red arrow candle’s high within 3-5 bars, the signal has failed; cut losses quickly at 50% of initial risk.
Making It Work in Your Trading
The indicator fits best as a component within a broader trading system. Use it to identify potential setups, then apply your own confirmation checklist. Does the signal align with higher timeframe trend? Is there nearby structure that could invalidate the trade? What’s the risk-reward ratio if you enter here?
Risk warnings aside, traders who treat signals as possibilities rather than certainties tend to do better. Taking every arrow blindly leads to poor results. But filtering signals through additional criteria time of day, economic calendar events, volatility conditions improves the win rate significantly.
For traders stuck in analysis paralysis or those wanting to expand beyond a handful of watched pairs, this indicator serves a useful purpose. It scans, it alerts, it suggests. What happens next depends on the trader’s skill in execution and risk management. There’s no shortcut to that part, but having a reliable signal generator removes one source of decision fatigue from the trading process.
Recommended MT4/MT5 Broker
XM Broker
- Free $50 To Start Trading Instantly! (Withdraw-able Profit)
- Deposit Bonus up to $5,000
- Unlimited Loyalty Program
- Award Winning Forex Broker
- Additional Exclusive Bonuses Throughout The Year
- Exclusive 90% VIP Cash Rebates for all Trades!


Already an XM client but missing out on cashback? Open New Real Account and Enter this Partner Code: VIP90


