


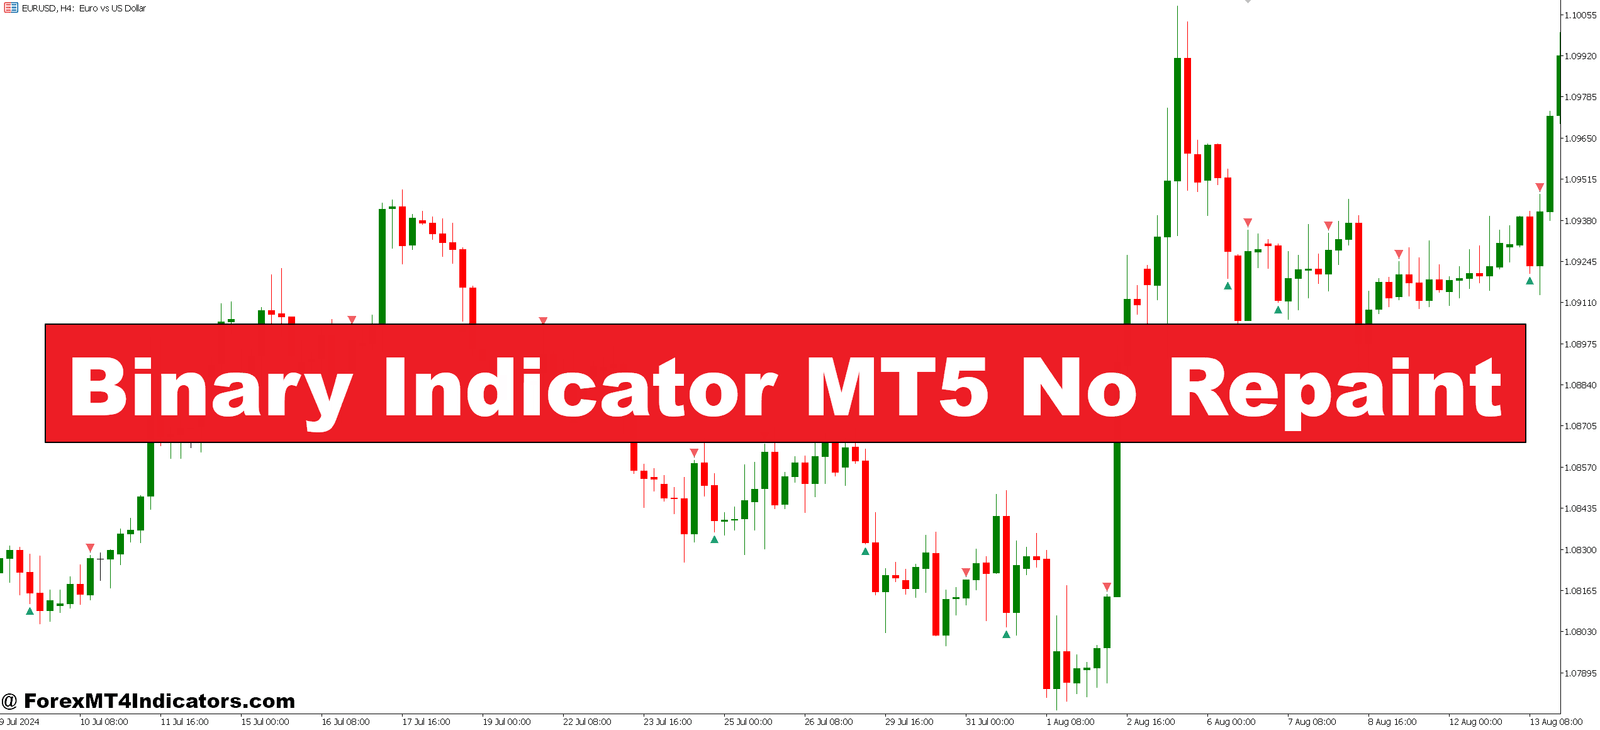

The Binary Indicator MT5 No Repaint operates as an arrow-based signal system that identifies potential entry points for binary options and forex trading. The “binary” label refers to its straightforward output: up arrows for buy signals and down arrows for sell signals. But here’s where it separates from the pack—once a candle closes and the indicator plots an arrow, that arrow becomes permanent.
Traditional indicators recalculate their values with each new tick. A moving average crossover might show a signal at 10:00 AM, but by 10:15 AM, after more price action develops, the indicator repaints and shows the crossover happened at 9:45 AM instead. This repainting creates an illusion of accuracy in backtests while failing miserably in live trading.
The no-repaint version commits to its signals. It analyzes price action, volatility, and momentum factors during candle formation, then finalizes the signal when the candle closes. Traders can review their charts days or weeks later and see the exact same signals they saw in real-time. This consistency matters when evaluating strategy performance or learning from past trades.
The Mechanics Behind the Signals
Most no-repaint binary indicators combine multiple technical factors into a single decision framework. While exact algorithms vary between versions, the core logic typically evaluates three elements: trend direction, momentum strength, and volatility conditions.
The trend component often relies on moving average relationships or price position relative to dynamic support and resistance levels. When price trades above a fast-moving average that’s above a slower one, the trend filter shows bullish. Momentum confirmation comes from oscillator-type calculations—similar to RSI or Stochastic logic—checking whether current price movement has sufficient strength to justify a signal.
Here’s what separates effective implementations: they wait for candle close before committing to any signal. During candle formation, the indicator might show preliminary calculations internally, but it won’t display an arrow until the time period completes. On a 15-minute chart, this means no signal appears until the 15 minutes expire and the candle closes.
Some traders initially resist this delay. They want instant signals the moment conditions align. But that impatience is precisely what repainting indicators exploit. The Binary Indicator MT5 No Repaint sacrifices the illusion of perfect timing for the reality of dependable data.
Real-World Trading Scenarios

Testing this indicator on GBP/JPY during the London session revealed interesting patterns. On volatile days when the pair moves 80-100 pips, the indicator generated 4-6 signals across a 5-hour window. The accuracy wasn’t perfect—no indicator is—but the signals remained consistent when reviewing the session afterward.
One specific example: GBP/JPY broke above 188.50 resistance on a Thursday morning. The indicator fired a buy arrow at 188.65 when the 5-minute candle closed above the breakout level. Price rallied to 189.20 over the next 45 minutes. Three hours later, when checking the charts, that buy arrow still sat exactly at 188.65. A repainting indicator might have moved it to 188.50, 188.55, or even removed it entirely depending on subsequent price action.
For USD/CAD traders focusing on daily charts, the signal frequency drops significantly—maybe 2-3 per week. But those signals carry more weight. When the indicator flagged a sell signal at 1.3620 after a bearish engulfing pattern, it aligned with broader technical analysis showing resistance from the 200-day moving average. That signal stayed valid during the subsequent three-day decline to 1.3480.
The key insight? Signal quality varies by market conditions. During choppy, range-bound periods, even no-repaint indicators generate false signals. The difference is traders can accurately assess win rates and adjust strategies accordingly because the historical record stays intact.
Customization for Different Trading Styles

Most versions of this indicator include adjustable parameters for sensitivity and filtering. The sensitivity setting determines how strong the technical conditions must be before generating a signal. Lower sensitivity produces more signals with reduced reliability. Higher sensitivity creates fewer, more selective signals.
Traders working 1-minute charts for binary options often prefer lower sensitivity settings since they’re making dozens of trades per session. They accept a 55-60% win rate across high volume. Swing traders on 4-hour or daily charts typically increase sensitivity to filter out noise and focus on major reversal or continuation setups.
Alert options matter too. Email notifications, push alerts to mobile devices, or simple sound alarms—different traders have different monitoring styles. Scalpers watching 12 pairs simultaneously need audio cues. Position traders checking charts twice daily might prefer email summaries.
That said, over-optimization becomes a trap. Adjusting settings to perfectly fit historical data often creates parameters that fail in live trading. The indicator works best with moderate, common-sense settings tested across multiple currency pairs rather than fine-tuned for one specific pair’s past performance.
Honest Assessment: Strengths and Limitations
The primary advantage is reliability. Traders develop genuine trust when their tools don’t change their mind about historical signals. This consistency enables accurate performance tracking, strategy refinement, and psychological confidence. Knowing an arrow at yesterday’s close will still be there tomorrow eliminates a major source of trading frustration.
The indicator also simplifies decision-making. Rather than analyzing six different indicators and trying to synthesize conflicting signals, traders get straightforward directional guidance. This clarity helps newer traders build confidence while giving experienced traders a quick confirmation tool.
But limitations exist. No indicator predicts the future, and no-repaint status doesn’t equal guaranteed accuracy. The indicator can generate a valid buy signal at 1.1050 on EUR/USD, then price can immediately drop 40 pips if economic news hits. The signal didn’t repaint—it was genuinely wrong about market direction in that instance.
Lag represents another constraint. Waiting for candle close means traders enter slightly late compared to indicators that signal mid-candle. On a 30-minute chart, this delay might cost 5-10 pips of potential profit. For long-term traders, this barely registers. For scalpers targeting 8-pip moves, it’s significant.
The indicator also struggles during major news events. When the Federal Reserve announces policy changes or NFP data releases, price whipsaws violently. The indicator might fire a buy signal, only for price to reverse 60 seconds later—not because the indicator repainted, but because fundamental data overwhelmed technical analysis.
How It Stacks Up Against Alternatives
Compared to basic moving average crossovers, the Binary Indicator MT5 No Repaint offers more sophisticated signal filtering. A simple 10/20 EMA crossover generates signals constantly, including many false alarms during sideways markets. The binary indicator’s multi-factor approach reduces noise.
Against more complex systems like Ichimoku Cloud or Elliott Wave indicators, the binary approach trades depth for simplicity. Ichimoku provides detailed information about support, resistance, momentum, and trend all at once. But that complexity overwhelms many traders. The binary indicator sacrifices nuance for clarity.
RSI or MACD divergence strategies offer comparable reliability without the “black box” concern some traders have about proprietary indicators. With RSI, traders understand exactly what they’re seeing: overbought/oversold conditions or divergence patterns. The binary indicator requires more trust in the underlying algorithm.
The choice depends on trading style and experience level. Traders who want to understand every aspect of their analysis might prefer standard indicators they can verify. Those who value streamlined decision-making and are comfortable with algorithmic filtering often prefer the binary approach.
How to Trade with Binary Indicator MT5 No Repaint
Buy Entry

- Wait for candle close confirmation – Never enter mid-candle when you see a preliminary signal; wait for the full period (5-min, 15-min, 1-hour) to complete before taking the buy arrow seriously.
- Check trend alignment on higher timeframe – If trading 15-minute charts on EUR/USD, confirm the 1-hour or 4-hour chart shows upward momentum; don’t take buy signals during strong daily downtrends.
- Set stop loss 10-15 pips below signal candle – Place your stop beneath the low of the candle that triggered the buy arrow, adding 2-3 pips buffer for spread and volatility on pairs like GBP/USD.
- Target 1.5 to 2x your risk – If you’re risking 20 pips, aim for 30-40 pip profit targets; this risk-reward ratio keeps you profitable even with 50-55% win rates.
- Skip signals during major news releases – Avoid buy arrows that appear 15 minutes before or after NFP, FOMC, or central bank announcements when price whipsaws invalidate technical analysis.
- Look for confluence with support levels – Strongest buy signals occur when the arrow appears near previous support zones, round numbers (1.1000 on EUR/USD), or rising trendlines.
- Reduce position size in ranging markets – If EUR/USD has stayed within a 50-pip range for 8+ hours, cut your normal position size by 50% since breakout signals often fail in choppy conditions.
- Exit partial position at 1:1 risk-reward – Take 50% profit when price moves equal to your stop distance, then let the remainder run with a trailing stop to lock in gains if the trend continues.
Sell Entry

- Confirm the sell arrow at candle close – Like buy signals, sell arrows are only valid after the timeframe completes; a 4-hour sell signal isn’t confirmed until that 4-hour candle fully closes.
- Verify downtrend on larger timeframe – Don’t take sell signals on 5-minute GBP/JPY charts if the daily chart shows a strong uptrend; counter-trend trades have lower success rates below 45%.
- Place stop loss 10-15 pips above entry – Position your stop above the high of the signal candle plus spread buffer; on volatile pairs like GBP/JPY, add an extra 5 pips for normal fluctuation.
- Use trailing stops once in 20+ pip profit – After price moves favorably by 20 pips, trail your stop 10-15 pips behind current price to protect gains while allowing the downtrend to develop.
- Avoid signals near strong support zones – Skip sell arrows within 20 pips of major support levels, 200-day moving averages, or previous swing lows where price often bounces.
- Don’t chase signals after 30+ pip moves – If EUR/USD already dropped 40 pips before the sell arrow appears, you’ve missed the initial move; wait for a retracement or the next setup instead.
- Reduce risk during Asian session low volatility – When trading USD/CAD or EUR/USD between 2-6 AM GMT, these pairs often move less than 15 pips per hour, making signals less reliable.
- Exit if price closes above signal candle high – Your sell trade is likely invalidated if price reverses and closes a full candle above where the sell arrow appeared; don’t hold losing trades hoping for recovery.
Final Thoughts
The Binary Indicator MT5 No Repaint addresses a genuine problem in technical analysis—the unreliability of repainting tools that distort trading history and inflate backtested performance. By committing to signals at candle close, it provides consistent, reviewable data that traders can trust when evaluating strategy effectiveness. The straightforward arrow system simplifies analysis without oversimplifying market complexity.
That said, realistic expectations remain crucial. This indicator won’t transform a losing trader into a profitable one overnight. It won’t work equally well across all market conditions. Choppy, low-volatility periods generate questionable signals regardless of the indicator’s quality. Strong trending days produce better results but fewer opportunities.
Smart traders use this tool as one component of a complete trading system—combining it with proper risk management, market context analysis, and their own developing intuition about price behavior. They appreciate the no-repaint feature not because it guarantees success, but because it provides honest, unchanging data to learn from.
Recommended MT4/MT5 Broker
XM Broker
- Free $50 To Start Trading Instantly! (Withdraw-able Profit)
- Deposit Bonus up to $5,000
- Unlimited Loyalty Program
- Award Winning Forex Broker
- Additional Exclusive Bonuses Throughout The Year
- Exclusive 90% VIP Cash Rebates for all Trades!


Already an XM client but missing out on cashback? Open New Real Account and Enter this Partner Code: VIP90


