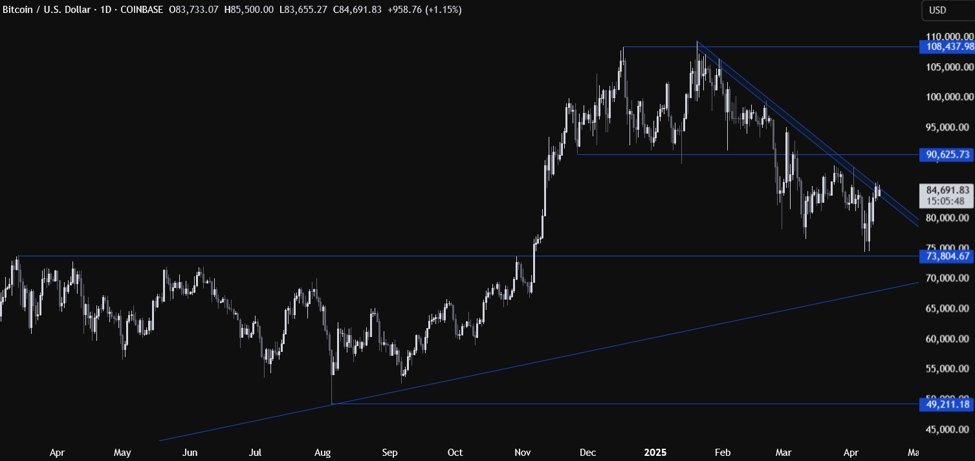
The pause in reciprocal tariffs last Wednesday boosted Bitcoin and risk assets in general as growth fears eased and the market started to look forward to more de-escalation ahead.
We also got some exemptions last Friday on tech which helped risk assets but Trump eventually poured cold water on positive expectations as he said that they will be short-lived and they are planning for new tariffs.
Bitcoin daily chart
On the daily chart above, we can see that Bitcoin is now trading right at the key trendline. This is where we can expect the sellers to step in with a defined risk above the trendline to position for a drop into the 70,000 level. The buyers, on the other hand, will want to see the price breaking higher to start targeting the 90,625 level next.

