





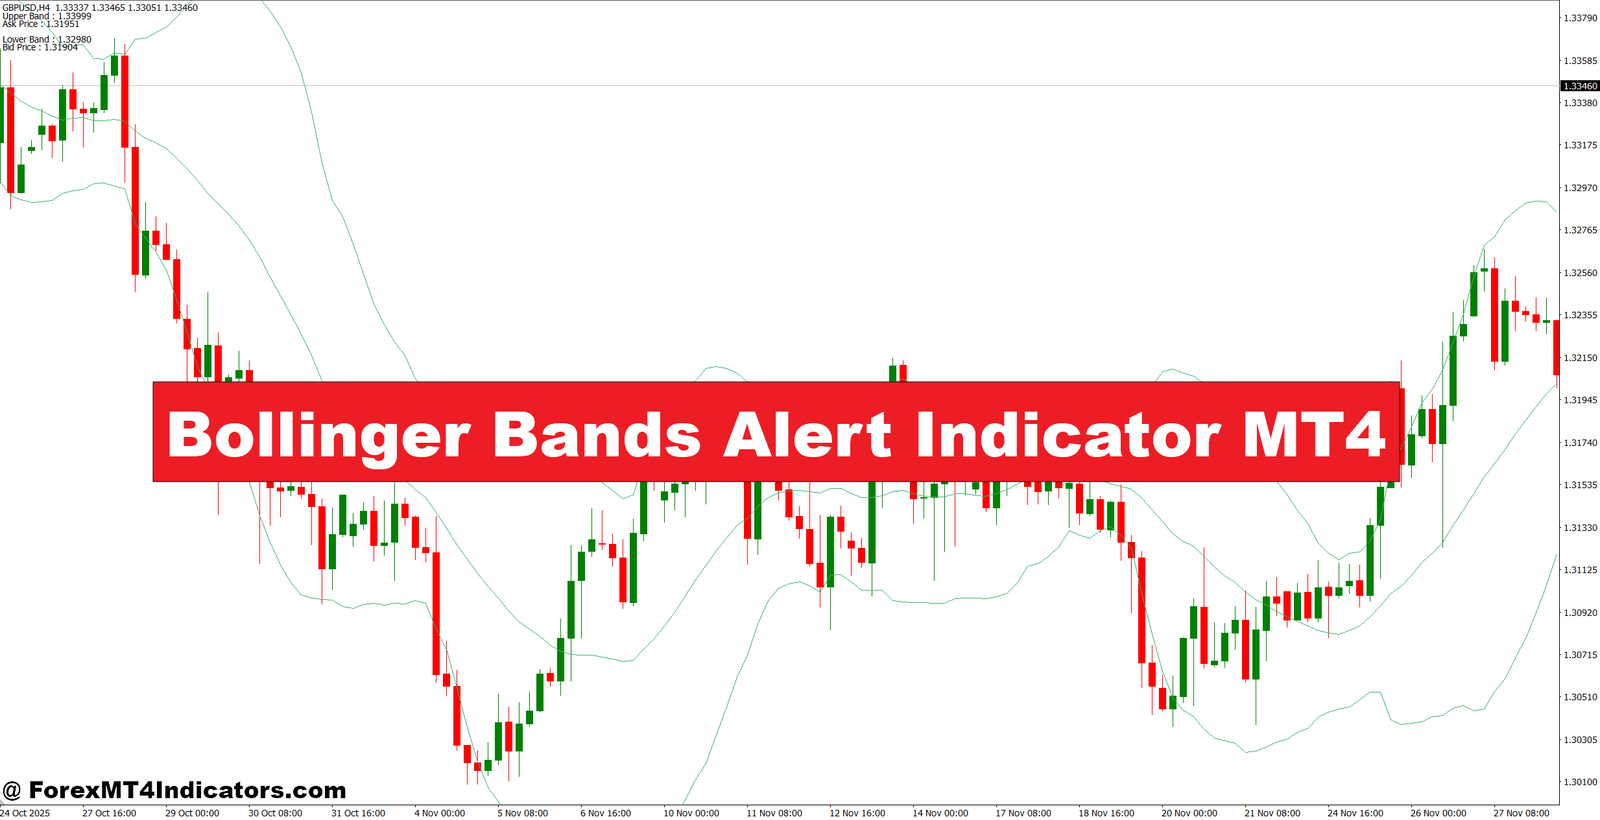
The Bollinger Bands Alert Indicator MT4 is a MetaTrader 4 tool that monitors price in relation to Bollinger Bands and produces alerts when predefined conditions occur. Depending on the version, alerts may appear as pop-ups, sounds, notifications, arrows, or messages when price touches or crosses an upper or lower band.
The underlying Bollinger Bands calculation is straightforward. A middle band usually uses a 20-period simple moving average (SMA). The upper and lower bands are then placed a set number of standard deviations away from that average.
For example:
- Middle Band = 20-period SMA
- Upper Band = SMA + 2 × standard deviation
- Lower Band = SMA − 2 × standard deviation
The bands expand when volatility increases and contract when volatility falls. This makes them useful for spotting unusual price movement, compression periods, and potential breakout conditions.
But the alert logic adds another layer. Instead of manually checking the chart for every band interaction, traders can let MT4 monitor the condition and notify them.
How the Indicator Works in Real Trading
The key is understanding what the alert actually means. A touch of the upper Bollinger Band doesn’t automatically mean “sell.” In a strong trend, price can remain near the upper band for several candles. The same applies to the lower band during a strong bearish move.
Consider EUR/USD on a 1-hour chart. Suppose the bands use a 20-period SMA and a deviation of 2.0. Price pushes from 1.0840 to 1.0915 and closes above the upper band. The alert tells the trader that price has moved outside its normal volatility range.
At that point, the trader can check structure. If EUR/USD has just broken resistance at 1.0900 with strong bullish candles, buying the breakout may make more sense than immediately shorting it.
Now imagine a different setup. GBP/USD reaches the upper band around 1.2780 after a rapid 70-pip rally. A bearish engulfing candle forms directly below resistance at 1.2790, and the next candle closes below the previous low. The alert becomes more useful here because price action is confirming a possible reversal.
This is where experienced traders tend to differ from beginners. They don’t treat every notification as an entry order.
Using Alerts With Market Structure
A practical approach is to combine the alert with support and resistance.
For example, if USD/JPY touches the lower band near a well-tested H1 support zone at 147.20, traders can watch for rejection. A bullish candle closing back above 147.35 may provide a stronger entry trigger than the band touch alone.
A possible plan could be:
- Entry: 147.35
- Stop-loss: 147.05
- Risk: 30 pips
- First target: 147.95
- Risk-to-reward: roughly 1:2
The exact levels depend on the chart. The point is that the Bollinger alert identifies the area, while price structure helps decide what happens next.
Settings for Different Forex Timeframes
The default Bollinger settings of 20 periods and 2.0 standard deviations are a reasonable starting point, but traders don’t have to use them on every chart.
On an M15 chart, a trader looking for short intraday moves might test 20 periods with a 2.0 deviation. Alerts will occur more frequently, so filtering becomes essential. Lower timeframes contain more market noise and fake-outs.
On H1, the same 20/2 configuration can provide fewer but cleaner setups. For swing-oriented analysis, some traders may test 20 periods with 2.2 or 2.5 deviations to reduce the number of alerts.
For example, a trader watching XAU/USD on the 4-hour chart might find a 2.5 deviation useful during highly volatile periods. Gold can move 30–60 pips quickly, so a tighter setting could create too many notifications.
The best settings should be tested on the actual pair and timeframe rather than copied blindly.
Another useful adjustment is alert frequency. If the indicator supports alerts on every tick, traders may receive repeated notifications while price remains around a band. An alert based on candle close can be cleaner because it waits for confirmation from the completed bar.
Advantages and Limitations
The biggest advantage is attention management. Traders don’t need to keep switching between ten charts waiting for price to reach a particular volatility level.
It can also help with structured watchlists. For instance, someone monitoring EUR/USD, GBP/USD, USD/JPY, and AUD/USD can wait for alerts before examining each chart more closely.
There are drawbacks, too.
An alert does not understand the full market context. It won’t automatically know that a major central-bank announcement is approaching or that price is moving directly into weekly resistance. During NFP releases, CPI reports, or unexpected news, Bollinger Band alerts can become extremely active.
When testing this type of setup during volatile NFP sessions, traders should expect sharp band expansions and false breakouts. A 25-pip move can happen in seconds, followed by a 40-pip reversal. Entering simply because an alert appeared is risky.
The indicator also depends on the quality of its settings and implementation. Different MT4 versions may offer different alert types and conditions. Traders should test the specific file in a demo account before using it with real funds.
Bollinger Bands Alert vs Other Indicators

Bollinger Bands and the Relative Strength Index (RSI) answer different questions.
Bollinger Bands focus heavily on volatility and the position of price relative to its moving average. RSI measures momentum. Combining them can therefore provide useful context.
For example, EUR/USD touching the lower band while the 14-period RSI is below 30 may suggest an oversold condition. But oversold doesn’t necessarily mean price will reverse. If the pair is breaking major support, the bearish trend can continue.
Moving averages are also different. A 50-period or 200-period moving average is often used to define broader trend direction, while Bollinger Bands show how far price is moving from its recent average.
A simple combination could be:
Trend: 50 EMA above 200 EMA
Alert: Price reaches lower Bollinger Band
Confirmation: Bullish rejection at H1 support
Risk: 0.5%–1% of account balance
Target: Next resistance zone
What makes this approach useful is the division of roles. The Bollinger alert finds the event, the moving averages provide trend context, and price action supplies the entry confirmation.
Still, no combination removes trading risk.
How to Trade with Bollinger Bands Alert Indicator MT4
Buy Entry

- Wait for a Lower-Band Alert – Look for price touching or briefly breaking the lower Bollinger Band on the 1-hour chart before considering a BUY.
- Confirm Bullish Rejection – Enter after a bullish candle closes back inside the bands, ideally with a 10–20 pip rejection wick.
- Check Support – Prefer BUY alerts near established H1 or H4 support rather than in the middle of a trading range.
- Use RSI Confirmation – On EUR/USD H1, consider the setup stronger when the 14-period RSI moves back above 30 after an oversold reading.
- Watch the 50 EMA – Favor BUY signals when price remains above the 50 EMA, showing that the broader short-term trend supports the trade.
- Set a 20–40 Pip Stop – Place the stop below the recent swing low instead of using the alert itself as the risk level.
- Target at Least 1:2 R:R – If risking 25 pips, aim for approximately 50 pips or the next major resistance zone.
- Avoid Strong Bearish Breakouts – Don’t BUY GBP/USD simply because the lower band alerts; avoid the setup when H4 or daily candles are closing strongly below support.
Sell Entry

- Wait for an Upper-Band Alert – Look for price touching or moving above the upper Bollinger Band on the H1 or H4 chart.
- Confirm Bearish Rejection – Consider entry after a bearish candle closes back inside the bands with a 10–20 pip upper wick.
- Check Resistance – Give more weight to SELL alerts around established H1, H4, or daily resistance levels.
- Use RSI Confirmation – On GBP/USD H1, a move back below 70 after an overbought reading can support the bearish setup.
- Confirm Below the 50 EMA – Prefer SELL trades when price stays below the 50 EMA and market structure remains bearish.
- Risk Only 0.5–1% – Keep account risk at 0.5%–1% per trade, especially when volatility is high.
- Use a 20–40 Pip Stop – Place the stop above the recent swing high while allowing enough room for normal market noise.
- Avoid Strong Bullish Breakouts – Don’t SELL EUR/USD just because the upper band alerts when H4 or daily candles are breaking resistance with strong momentum.
Conclusion
The Bollinger Bands Alert Indicator MT4 can make chart monitoring easier by notifying traders when price reaches important volatility boundaries. Its strongest use isn’t predicting every reversal. Instead, it helps traders identify moments that deserve closer attention.
- Bollinger Bands show volatility relative to a moving average.
- Alerts reduce the need to constantly watch multiple charts.
- Price action and support/resistance should confirm potential entries.
- Settings such as 20 periods and 2.0 deviations should be tested for each market and timeframe.
Used this way, the indicator becomes part of a trading process rather than a standalone signal generator. Traders should test their rules on demo accounts, review historical setups, and avoid increasing position size simply because an alert appears.
Trading forex carries substantial risk. No indicator guarantees profits. The better question is not whether an alert is correct every time, but whether the complete trading plan manages the losing trades when it isn’t.
Level up your trading
Learn to read the chart — not just the indicator
eBook · Instant PDF
The Candlestick Playbook
Read and trade 40+ candlestick patterns — with exact entries, stops and exits.
Video Course · 12 modules
The Price Action Masterclass
Read clean charts the no-indicator way — pin bars, support & resistance, entries and exits.
Recommended MT4/MT5 Brokers
XM
- ✓ *FREE *$50 to start (withdrawable)
- ✓ Deposit bonus up to $5,000
- ✓ Negative balance protection
Trading forex and CFDs carries a significant risk of loss and is not suitable for everyone. Broker links are affiliate links — we may earn a commission at no cost to you.
Free MT4 Indicator Download


