


Bonds and bond yields have been the markets to trade in 2022 thanks to global central banks’ focus to fight high inflationary conditions with rising interest rates.
How did bond prices and interest rates move and will the trends continue in 2023?
U.S. 10-Year Treasury Yield vs. Fed Funds Rate
U.S. 10-Year Treasury Yield vs. Fed Funds Rate by TradingView
We’ve got another potential longer-term setup on the watchlist, this time focusing on arguably the biggest theme of 2022, which will likely continue to be a big focus in early 2023: inflation and interest rates!
If you recall, inflation rates began rising rapidly in 2021, likely the result of a combination of macro factors: spiking economic activity as global economies were re-opening from pandemic protocols, massive government / central bank stimulus, constrained supply chains, etc.
It was originally thought by central banks that these inflation conditions would be “transitory”, but by late 2021 and early 2022, we saw that rhetoric change from central banks, most notably from the Federal Reserve. It was then in January 2022 that the Fed would begin raising interest rates in March 2022.
It was also then that the markets began pricing in this expectation as the yield on the U.S. 10-year Treasury Note began to rise, as seen in the chart above. And it barely skipped a beat in its rally higher, correlating with the Fed’s steady stream of rate hikes through 2022, bringing the effective Federal Funds Rate from 0.0% to its current rate around 4.33%.

20 Plus Year Treasury Bond ETF (TLT) by TradingView
This rapidly rising rate environment had a negative effect on bond prices, as seen in the 20 Plus Year Treasury Bond ETF (TLT), which is used by many traders to express a bias on U.S. bond prices. This ETF is mainly traded in the U.S., but exposure to TLT can also be found outside of the U.S. as a CFD with many brokers around the world.
As we can see on the daily chart of TLT that bonds fell out of favor hard (falling by around -37% at 2022 lows), likely on the basic bond trading principle that if interest rates rise, bond buying sentiment will likely fall as investors wait to buy bonds with higher yields later, and/or sell lower-yielding bonds to buy higher-yielding bonds later.
In hindsight, this was arguably one of the easiest trades ever as the Fed said they would be aggressive in their fight against inflation, as inflation data showed prices remain sticky and employment data showed a strong jobs market in the U.S.
But that was 2022…what’s in store for bond prices in 2023?
Right now, the consensus seems to be that the Fed will continue to stay hawkish on interest rates given the strong labor market in the U.S. At their final FOMC meeting in December, policy makers projected that rates would end 2023 somewhere near 5.1%, around 60 bps to 85 bps above the current target range of 4.25% to 4.5%.
So, if inflation conditions do not slow and interest rates continue to push higher, could TLT make another run at previous swing lows and possibly break them?
Of course, we won’t know until we get further data, but for now, the current consensus outlook and the price trend in TLT favors the bears, making potential bearish play in TLT one to watch until the next FOMC meeting in February.

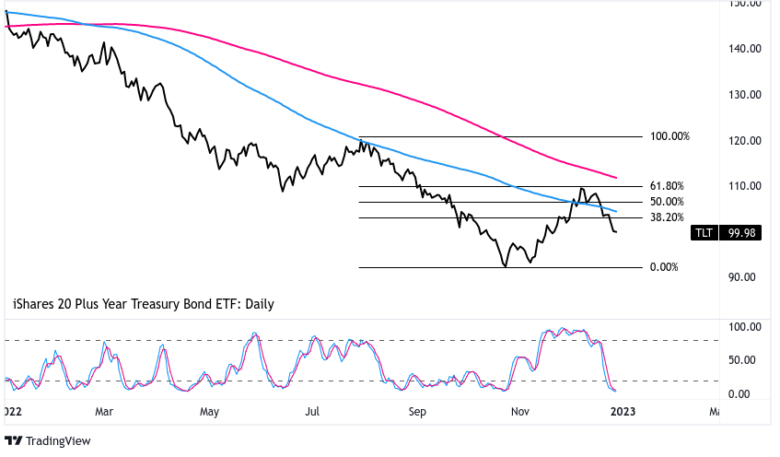
20 Plus Year Treasury Bond ETF (TLT) by TradingView
On the zoomed in daily chart of TLT, we can see that the bounce seems to have already found its swing top in between the falling 100 and 200 SMA, as well as the 61% Fibonacci retracement level (which lined up with the previous broken swing low from back in June).
With this price action likely confirming a bearish reversal, it’s likely to draw in technical trend traders and fundie traders back into the trend lower. And if the momentum strengthens, we could see traders potentially take the market to the previous swing low at $91.85 and possibly break it.
That means a roughly a -7.5% move from current price levels, but if using a break above the 61% as a trade invalidation point (stop), then the risk-to-reward (R:R) isn’t favorable if $91.85 is the max target.
So, we’ll be on the look out to see if TLT bounces back into the Fibs / SMAs before considering a short play to make the R:R potential make more sense, a possible scenario given that the latest short-term move has created an “oversold” stochastic signal.
And with the end-of-year quickly approaching, a potential profit taking scenario could possibly spark a small bounce.
Of course, we’ll also be on the lookout for hints of changing inflation conditions or commentary from Fed officials ahead of the February FOMC meeting. Any suggestions of a potential slow down, halt, or even reversal of interest rate hikes in 2023 would definitely affect our bias on TLT.
But what do you think? Is TLT as sell or should we be considering a bullish play, especially on a sustained break above the moving averages? Let us know in the comment section below!
This content is strictly for informational purposes only and does not constitute as investment advice. Trading any financial market involves risk. Please read our Risk Disclosure to make sure you understand the risks involved.


