






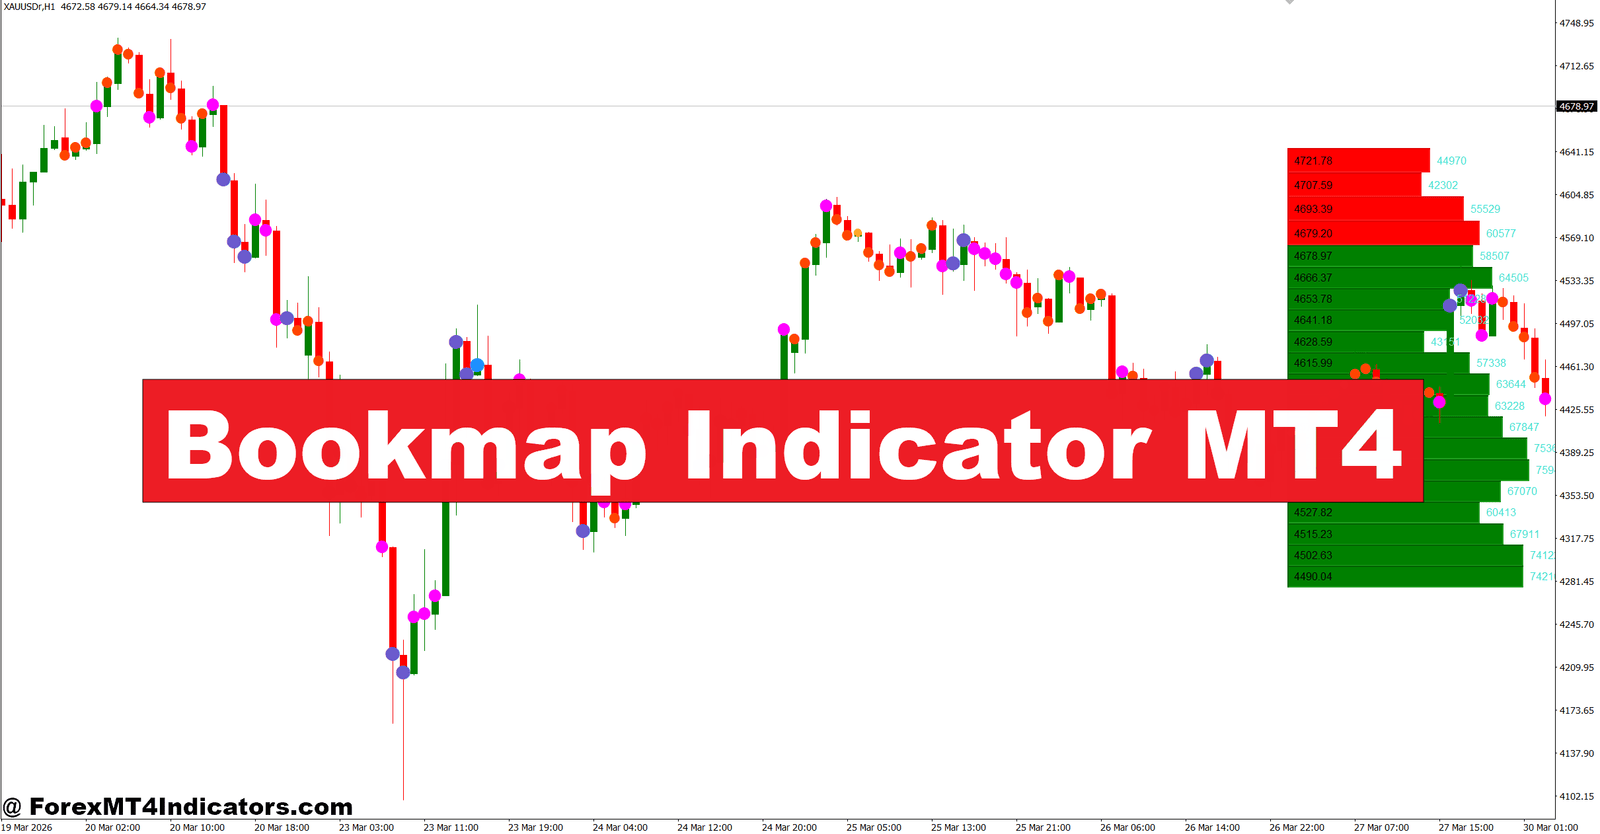
The Bookmap Indicator MT4 is designed to give traders a better view of market activity by highlighting liquidity and order flow concepts that traditional chart tools may overlook.
Missing these details can lead to poor entries, unnecessary losses, and emotional trading decisions. After several losing trades, many traders start chasing the market or exiting winning positions too early. That cycle is difficult to break without better market information. A Bookmap-style indicator helps traders focus on areas where larger participants may be active, making trade planning more structured. Before adding it to a trading strategy, it’s worth understanding how it works, where it performs well, and where its limitations begin.
What Is the Bookmap Indicator MT4?
The Bookmap Indicator MT4 is a technical analysis tool inspired by the order flow and market depth concepts available in professional trading platforms. Since MetaTrader 4 doesn’t provide a true centralized order book for the decentralized forex market, most MT4 versions of this indicator simulate liquidity zones using price action, tick volume, historical support and resistance, and market momentum.
Instead of relying only on moving averages or oscillators, it attempts to identify areas where buying or selling pressure is likely to increase. These zones often become reaction points where price slows down, reverses, or accelerates.
Many traders combine this indicator with market structure analysis rather than treating it as a standalone signal generator. That’s usually a smarter approach because liquidity areas often work best when they align with trend direction and key price levels.
How the Bookmap Indicator MT4 Works

Unlike classic indicators that calculate averages from closing prices, the Bookmap Indicator MT4 analyzes several market factors together.
It generally tracks:
- Tick volume changes
- Recent price swings
- High-volume reaction zones
- Support and resistance clusters
- Momentum shifts during active trading sessions
When buying pressure increases near an important support area, the indicator may highlight that region with colored zones or visual markers. If sellers dominate around resistance, it may display a potential selling area instead.
For example, EUR/USD on the 1-hour chart may pull back toward 1.1250 after a strong uptrend. The indicator highlights this price level as a liquidity zone while tick volume rises above its recent average. Price then forms a bullish engulfing candle before continuing another 45 pips higher. In this case, the indicator didn’t predict the move—it simply helped identify where buyers were becoming active.
During testing on volatile NFP days, these zones often shifted quickly as liquidity changed. Waiting for the news candle to close before acting generally produced cleaner trade setups than entering immediately after the release.
Applying the Indicator in Real Trading
The indicator becomes much more useful when traders combine it with price action confirmation.
Imagine GBP/USD trending upward on the 4-hour chart. Price retraces about 70 pips into a highlighted liquidity area near a previous breakout level. Instead of buying immediately, the trader waits for a bullish pin bar to appear on the 30-minute chart. The stop-loss sits roughly 25 pips below the recent swing low, while the initial profit target is 60 pips.
That setup offers a risk-to-reward ratio greater than 1:2 without relying only on the indicator.
Another example appears on USD/JPY during the Asian session. Price reaches a marked selling zone but volume remains weak. No bearish candle develops, and momentum stays positive. Passing on the trade saves the trader from entering a fake-out that later pushes another 35 pips higher.
Here’s the thing: liquidity zones should guide attention, not replace trade confirmation. Candlestick patterns, trend direction, and higher-timeframe structure still deserve equal importance.
Trading forex carries substantial risk. No indicator guarantees profits.
Settings and Customization for Different Markets
Most versions of the Bookmap Indicator MT4 allow traders to adjust sensitivity, volume filtering, and historical lookback periods.
For scalping on the 5-minute or 15-minute charts, traders often reduce the lookback period so the indicator reacts faster to short-term market changes. A shorter setting can identify fresh liquidity zones during active sessions like London or New York.
Swing traders usually prefer slower settings on the 4-hour or daily charts. This removes much of the market noise and highlights stronger institutional reaction levels.
Suggested starting points include:
Short-Term Trading
- Timeframes: M5 to M15
- Moderate sensitivity
- Short lookback period
- Focus on London and New York sessions
Intraday Trading
- Timeframes: H1 to H4
- Medium sensitivity
- Standard volume filter
- Confirmation from market structure
Swing Trading
- Timeframes: H4 to Daily
- Lower sensitivity
- Longer historical analysis
- Confirmation from higher highs and higher lows
No single setting fits every currency pair. EUR/USD often behaves differently from GBP/JPY because volatility levels vary significantly.
Strengths, Weaknesses, and Comparison with Similar Indicators
One reason traders like the Bookmap Indicator MT4 is its ability to highlight areas where market interest appears strongest. Instead of reacting after large moves occur, it encourages traders to prepare around important price levels.
Some notable strengths include:
- Helps identify potential liquidity zones.
- Works well alongside support and resistance analysis.
- Useful for filtering low-quality breakout trades.
- Fits both intraday and swing trading strategies.
There are limitations too.
Because forex lacks a centralized exchange, MT4 cannot display true institutional order book data like futures markets. The indicator relies on estimates built from available market information rather than actual pending orders. During low-volume periods or holiday trading sessions, those estimates become less reliable.
Compared with Volume Profile indicators, the Bookmap Indicator MT4 places greater emphasis on changing liquidity rather than historical volume distribution. Compared with VWAP, it focuses more on potential reaction zones than average traded price. Against Moving Averages, it offers more context around price levels but less trend smoothing.
Experienced traders rarely choose one over another. Instead, they often combine these tools to build stronger trade confirmation.
How to Trade with Bookmap Indicator MT4
Buy Entry

- Buy at a liquidity support zone – Enter when EUR/USD on the 1-hour chart bounces from a highlighted liquidity area with a bullish candle. Place a 20-30 pip stop-loss.
- Wait for volume confirmation – Buy only if buying volume increases by 15-20% near the support zone.
- Trade with the higher trend – Take buy trades only when the 4-hour trend remains bullish.
- Confirm with a bullish candlestick – Enter after a bullish engulfing or pin bar closes above the liquidity zone.
- Target a 1:2 risk-reward ratio – Risk 25 pips to aim for at least 50 pips profit.
- Avoid low-volume sessions – Skip buy signals during quiet market hours or before major news releases.
- Use a trailing stop – Lock in profits after the trade moves 30 pips in your favor.
- Check daily market structure – Buy only if the daily chart continues making higher highs and higher lows.
Sell Entry

- Sell at a liquidity resistance zone – Enter when GBP/USD on the 1-hour chart rejects a highlighted resistance area with a bearish candle. Use a 20-30 pip stop-loss.
- Confirm rising selling volume – Sell only if bearish volume increases by 15-20% around resistance.
- Follow the higher-timeframe trend – Take sell trades only when the 4-hour trend is bearish.
- Wait for bearish price action – Enter after a bearish engulfing or shooting star confirms seller control.
- Aim for a 1:2 risk-reward ratio – Risk 25 pips to target at least 50 pips profit.
- Avoid trading against strong momentum – Ignore sell signals if the daily trend remains strongly bullish.
- Move stop to breakeven – Protect the trade after price moves 25-30 pips in profit.
- Skip high-impact news events – Don’t enter sell trades just before releases like NFP, CPI, or FOMC, as liquidity zones may fail temporarily.
Final Thoughts
The Bookmap Indicator MT4 offers traders another way to study liquidity, market participation, and potential turning points without relying solely on lagging indicators. It performs best when used alongside price action, trend analysis, and disciplined risk management. Key takeaways include identifying liquidity zones before entering trades, confirming signals with candlestick patterns instead of trading every highlighted area, adjusting settings for different trading styles, and accepting that no indicator removes market uncertainty. Traders who treat this tool as part of a complete trading plan rather than a shortcut to quick profits are more likely to use it effectively over the long term.
Recommended MT4/MT5 Broker
XM Broker
- *FREE $50 To Start Trading Instantly! (Withdraw-able Profit)
- Deposit Bonus up to $5,000
- Unlimited Loyalty Program
- Award Winning Forex Broker
- Additional Exclusive Bonuses Throughout The Year


>> Sign Up for XM Broker Account here <<
(Free MT4 Indicators Download)




