

")


The BSI Trend and Channel MT4 Indicator is a powerful technical analysis tool designed to identify trend directions and potential support or resistance zones. It combines trend recognition with dynamic price channels, allowing traders to see both the current market bias and the range in which price is likely to move. This visual approach helps simplify decision-making and reduces the need for multiple indicators cluttering the chart.
How It Works on the Chart
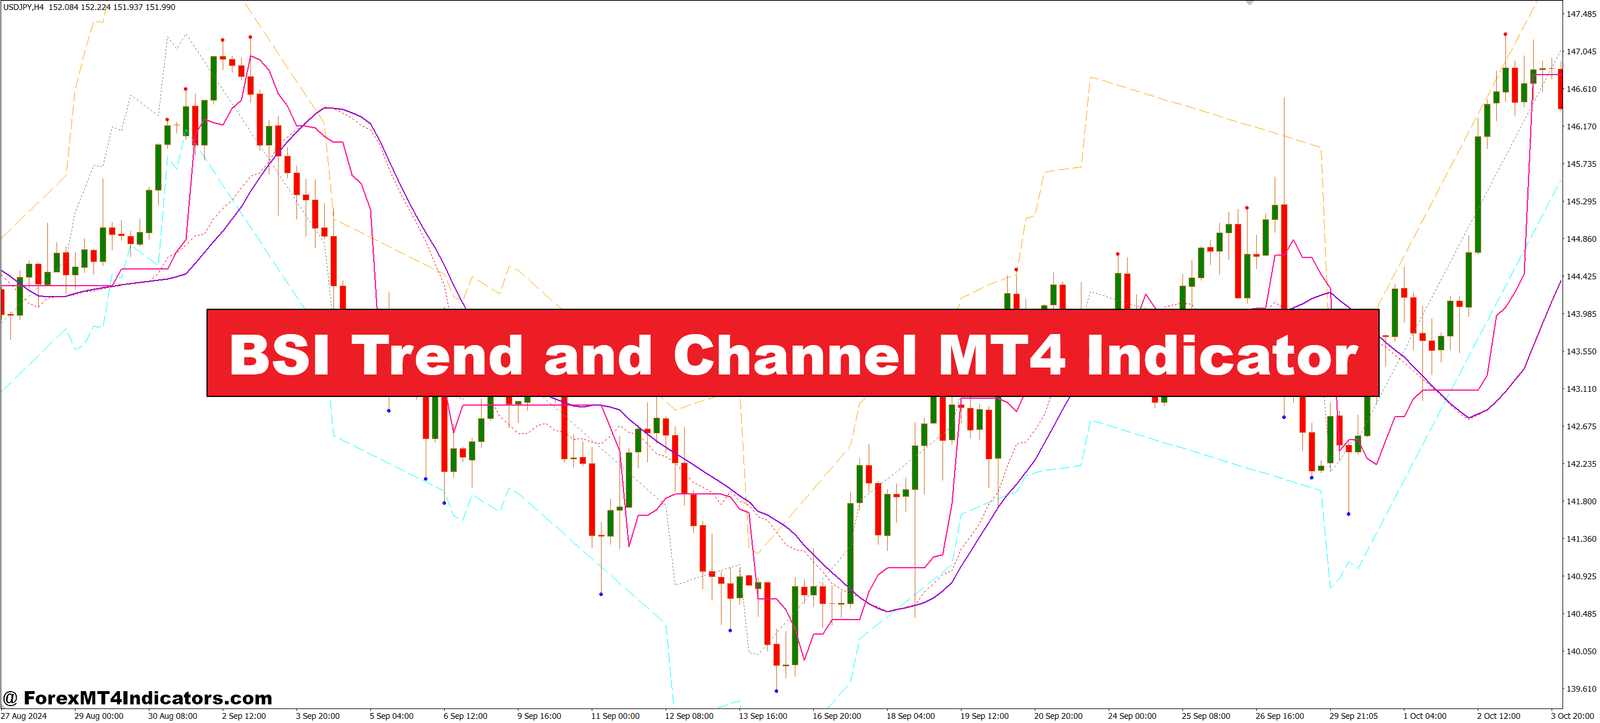
When applied to a chart, the BSI Trend and Channel Indicator plots colored lines and zones that represent the trend direction and potential price boundaries. For example, when the trend is up, the indicator highlights the upward path with green or blue tones, often forming a rising channel. In a downtrend, it shifts to red or orange tones, showing a descending price range. These visuals make it easier for traders to react quickly without overanalyzing the data.
Why Traders Like This Indicator
Traders in the U.S. market appreciate this indicator because it saves time and increases accuracy. Instead of constantly switching between trend lines, moving averages, and other tools, the BSI Trend and Channel Indicator wraps everything into one clean setup. It’s especially useful for beginners who want a simple and clear picture of what the market is doing. It works well across different timeframes, making it suitable for both day traders and swing traders.
Tips for Using It Effectively

The best way to use this indicator is to wait for a strong trend signal along with price staying inside or bouncing off the channel lines. When the price breaks out of the channel, it may indicate a trend reversal or strong continuation. Traders should also consider adding a volume indicator or confirmation pattern, like a candlestick formation, to validate entries. Keeping it simple and consistent is key to making the most of the BSI Trend and Channel tool.
How to Trade with BSI Trend and Channel MT4 Indicator
Buy Entry

- Wait for the indicator to show an uptrend channel (usually blue or green lines).
- Ensure the price is above the midline of the channel.
- Look for a bullish candle bouncing off the lower channel line (support).
- Confirm the trend strength with another tool like RSI or volume (optional).
- Enter a buy trade when the price respects the channel support and starts moving upward.
- Place a stop-loss just below the lower channel line or recent swing low.
- Take profit near the upper channel line or next resistance zone.
Sell Entry

- Wait for the indicator to show a downtrend channel (usually red or orange lines).
- Make sure the price is below the midline of the channel.
- Watch for a bearish candle rejecting the upper channel line (resistance).
- Use confirmation from another indicator like MACD or Stochastic (optional).
- Enter a sell trade when the price fails to break above the resistance and starts heading down.
- Place a stop-loss just above the upper channel line or recent swing high.
- Take profit near the lower channel line or next support level.
Conclusion
The BSI Trend and Channel MT4 Indicator gives traders an edge by offering a clear view of trends and price movement ranges. Whether you’re new to trading or already experienced, this indicator helps simplify your analysis and improve your timing. With less guesswork and more visual clarity, it can make your trading more focused and effective.
Recommended MT4/MT5 Broker
XM Broker
- Free $50 To Start Trading Instantly! (Withdraw-able Profit)
- Deposit Bonus up to $5,000
- Unlimited Loyalty Program
- Award Winning Forex Broker
- Additional Exclusive Bonuses Throughout The Year
- Exclusive 90% VIP Cash Rebates for all Trades!


Already an XM client but missing out on cashback? Open New Real Account and Enter this Partner Code: VIP90


")

