


- The Canadian Dollar sheds weight on Tuesday, walks back Monday gains.
- Economic data from Canada remains absent on the calendar.
- Crude Oil is plunging as markets reassess slowing global growth, causing demand declines to outpace production cuts.
The Canadian Dollar (CAD) fell back on Tuesday as markets shuffled their stance following US Consumer Price Index (CPI) inflation figures that exactly met market expectations, pointing to dwindling growth looking forward.
Canada sees little to no meaningful data on the economic calendar this week, leaving the CAD to get dragged around the charts by the broader market. Crude Oil markets are seeing broad declines on declining demand concerns, further pressuring the Loonie.
Daily Digest Market Movers: US CPI meets expectations, price growth slowly cools
- The Canadian Dollar sees losses across the board on Tuesday, with slight to moderate declines against all but one of the CAD’s major currency peers.
- The CAD’s weakest performance sees it down half of a percent against the Japanese Yen (JPY) and four-tenths of a percent against the Swiss Franc (CHF).
- The Loonie’s ‘strongest’ performance is against the Australian Dollar (AUD), mostly flat against the Antipodean, with a close second going to a tenth of a percent decline against the post-CPI US Dollar (USD).
- US Consumer Price Index (CPI) inflation met the Street’s expectations across the board, with headline annualized CPI inflation ticking down from 3.2% to 3.1% and the MoM figure ticking up slightly from a flat 0.0% to 0.1%.
- Core CPI inflation (headline inflation less volatile food and energy prices) held steady at 4% for the YoY figure, with November’s MoM Core CPI printing slightly higher at 0.3% versus October’s 0.2%.
- Crude Oil markets are taking a leg down in the face of declining price growth from the US, adding further weight to ongoing energy market concerns about declining fossil demand eclipsing global production cuts, specifically from the Organization of the Petroleum Exporting Countries (OPEC).
- US West Texas Intermediate (WTI) Crude Oil slips back to $69.00 per barrel.
- The Canadian Dollar is getting dragged down in lockstep with deflating Crude Oil bids.
- Next up for markets will be the Federal Reserve’s (Fed) Monetary Policy Statement and updates to its Interest Rate Projections, both due on Wednesday at 19:00 GMT and to be followed up by a Press Conference at 19:30 GMT.
Canadian Dollar price today
The table below shows the percentage change of Canadian Dollar (CAD) against listed major currencies today. Canadian Dollar was the strongest against the Australian Dollar.
| USD | EUR | GBP | CAD | AUD | JPY | NZD | CHF | |
| USD | -0.29% | -0.13% | 0.08% | 0.07% | -0.36% | -0.15% | -0.33% | |
| EUR | 0.29% | 0.16% | 0.38% | 0.35% | -0.10% | 0.14% | -0.06% | |
| GBP | 0.13% | -0.16% | 0.22% | 0.19% | -0.23% | -0.01% | -0.21% | |
| CAD | -0.09% | -0.37% | -0.23% | -0.01% | -0.46% | -0.25% | -0.43% | |
| AUD | -0.07% | -0.35% | -0.20% | 0.03% | -0.44% | -0.21% | -0.42% | |
| JPY | 0.35% | 0.05% | 0.22% | 0.45% | 0.42% | 0.19% | 0.02% | |
| NZD | 0.14% | -0.14% | 0.02% | 0.24% | 0.22% | -0.22% | -0.20% | |
| CHF | 0.33% | 0.05% | 0.22% | 0.44% | 0.42% | -0.03% | 0.19% |
The heat map shows percentage changes of major currencies against each other. The base currency is picked from the left column, while the quote currency is picked from the top row. For example, if you pick the Euro from the left column and move along the horizontal line to the Japanese Yen, the percentage change displayed in the box will represent EUR (base)/JPY (quote).
Technical Analysis: Canadian Dollar trips over slumping Crude Oil, sends USD/CAD back over 1.3600
The Canadian Dollar (CAD) looks for the basement on Tuesday, backsliding across the board and shedding weight against all of its major currency peers.
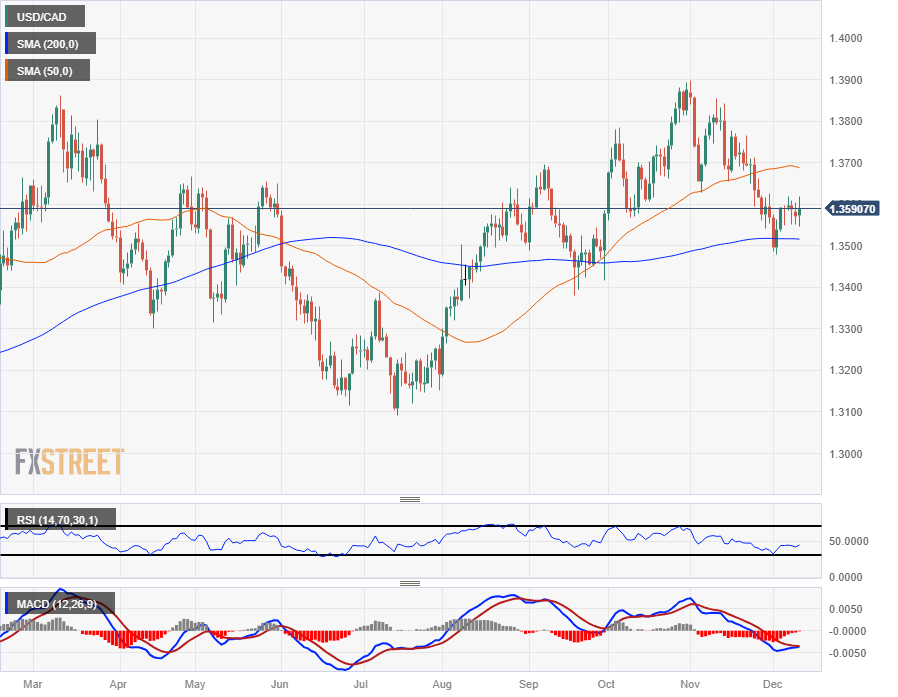
The USD/CAD has regained the 1.3600 handle after catching a topside break of consolidation between the 50-hour and 200-hour Simple Moving Averages (SMA) in the 1.3580 to 1.3560 zone.
The USD/CAD is toying with last week’s highs near 1.3620 after rebounding from familiar near-term lows at 1.3550. The pair is at risk of hardening into a sideways consolidation range, but the US Dollar (USD) is set up for further breakouts following central bank action on Wednesday.
The USD/CAD continues to hold chart territory north of the 200-day SMA just above the 1.3500 handle, keeping bids above the major moving average, but immediate topside momentum remains constrained by the 50-day SMA near 1.3700.
USD/CAD Hourly Chart
USD/CAD Daily Chart

Fed FAQs
Monetary policy in the US is shaped by the Federal Reserve (Fed). The Fed has two mandates: to achieve price stability and foster full employment. Its primary tool to achieve these goals is by adjusting interest rates.
When prices are rising too quickly and inflation is above the Fed’s 2% target, it raises interest rates, increasing borrowing costs throughout the economy. This results in a stronger US Dollar (USD) as it makes the US a more attractive place for international investors to park their money.
When inflation falls below 2% or the Unemployment Rate is too high, the Fed may lower interest rates to encourage borrowing, which weighs on the Greenback.
The Federal Reserve (Fed) holds eight policy meetings a year, where the Federal Open Market Committee (FOMC) assesses economic conditions and makes monetary policy decisions.
The FOMC is attended by twelve Fed officials – the seven members of the Board of Governors, the president of the Federal Reserve Bank of New York, and four of the remaining eleven regional Reserve Bank presidents, who serve one-year terms on a rotating basis.
In extreme situations, the Federal Reserve may resort to a policy named Quantitative Easing (QE). QE is the process by which the Fed substantially increases the flow of credit in a stuck financial system.
It is a non-standard policy measure used during crises or when inflation is extremely low. It was the Fed’s weapon of choice during the Great Financial Crisis in 2008. It involves the Fed printing more Dollars and using them to buy high grade bonds from financial institutions. QE usually weakens the US Dollar.
Quantitative tightening (QT) is the reverse process of QE, whereby the Federal Reserve stops buying bonds from financial institutions and does not reinvest the principal from the bonds it holds maturing, to purchase new bonds. It is usually positive for the value of the US Dollar.


