


The Candle Clock Indicator MT5 solves this timing problem with a simple countdown displayed right on your chart. It shows you the exact hours, minutes, and seconds remaining until the current candlestick closes, eliminating guesswork from your entry and exit decisions.
What the Candle Clock Indicator Actually Does

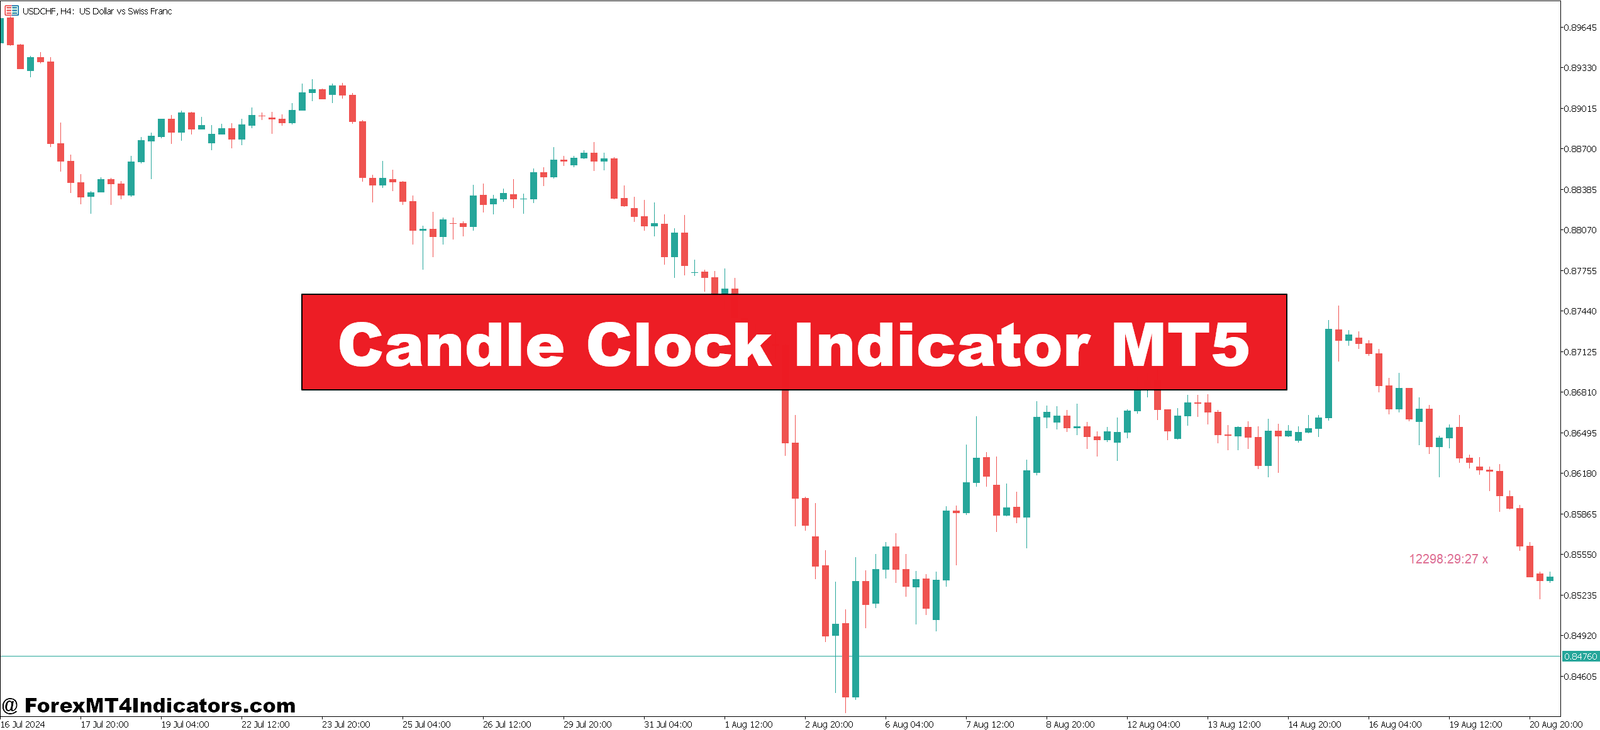
The Candle Clock Indicator (also called Candle Timer or Candle Time) is a MetaTrader 5 tool that stamps a live countdown next to your active price bar. It’s not analyzing price action or predicting movements—it’s doing something simpler but equally valuable: tracking time.
The indicator calculates the remaining duration based on your selected timeframe. On a 5-minute chart, it counts down from 5:00 to 0:00. On a 1-hour chart, it runs from 60:00 to zero. Once the candle closes, the timer resets automatically for the next bar.
Most versions display the countdown in H:M:S format (hours, minutes, seconds), though some compact versions show only minutes and seconds for lower timeframes. The timer typically appears either in a chart corner or positioned near the current candlestick, depending on your preference.
Here’s what makes it different from just glancing at your platform’s clock: MT5’s built-in time display shows server time, but it doesn’t tell you how much time remains in your specific candle. If you’re trading GBP/JPY on a 30-minute chart at 10:17 server time, you’d need to mentally calculate that 13 minutes remain. The Candle Clock does that math instantly and updates every second.
How Traders Actually Use It
The practical applications go beyond simple time awareness. When testing this on volatile NFP (Non-Farm Payroll) days, traders reported that the countdown helped them avoid entering during the initial whipsaw period. They’d set their charts to 15-minute timeframes and wait for the first post-news candle to fully close before making decisions.
For pattern traders, the indicator becomes essential. Consider a bullish engulfing pattern forming on USD/CAD’s 1-hour chart. The second candle needs to completely engulf the previous red candle’s body—but that’s only valid at the close. With 8 minutes remaining on the timer, you might see a promising setup. With 30 seconds left and the pattern still holding, you can prepare your entry order. Without the countdown, you’re either entering prematurely on what looks good mid-candle or scrambling to react after the close.
Breakout traders face similar challenges. Let’s say AUD/USD is testing resistance at 0.6550 on a 30-minute chart. The price pokes above at 0.6552, but you’ve got 12 minutes left on the candle. That’s enough time for a pullback below resistance—a classic fake-out. The timer tells you to wait. If the candle’s at 0.6554 with 45 seconds remaining, now you’ve got a legitimate breakout worth trading.
Some prop firm traders deal with specific rules like “no trading within 15 minutes of high-impact news.” They’ll switch to a 15-minute chart and use the countdown to know exactly when they can resume trading—no need to check external clocks or news calendars repeatedly.
Settings and Customization Worth Knowing

The indicator typically offers adjustments for text color, font size, and display position. Text color matters more than you’d think—on a dark chart theme, white or cyan text stands out clearly. On lighter backgrounds, black or dark blue works better.
Display position usually gives you two main options: chart corner (top-left, top-right, bottom-left, bottom-right) or next to the current bar. Chart corner placement keeps the timer visible regardless of price movement, which works well for set-and-forget monitoring. Next-to-bar placement moves with the candle, keeping the countdown contextually close to the action—preferred by scalpers who focus intensely on the current price bar.
Font size adjustments help with different screen setups. If you’re running multiple charts on one monitor, smaller text prevents clutter. Trading from a tablet or phone? Bump up the size for readability.
Some versions include spread display alongside the timer. This shows the current bid-ask spread for your instrument—useful for gauging trading costs in real-time. On major pairs like EUR/USD during London session, you might see 0.8 pips. During Asian hours on exotic pairs, that could jump to 4-5 pips, and the timer helps you correlate timing with spread costs.
Alert functions exist in certain variants. You can set an alert to trigger when, say, 60 seconds remain. This proves handy if you’re monitoring multiple pairs—you won’t miss a closing candle while focused elsewhere.
Real Advantages and Honest Limitations
The biggest advantage isn’t complicated: you stop second-guessing timing. That mental bandwidth previously spent calculating “how much longer?” gets redirected to analyzing price structure, reading market context, or managing open positions. For strategies dependent on confirmed candle closes—like Doji patterns, hammer confirmations, or trendline breaks—the countdown removes timing errors from the equation.
Scalpers benefit noticeably. On 1-minute charts, every second matters. Entering 15 seconds before the close versus 5 seconds after creates different risk/reward scenarios. The indicator quantifies that difference.
But here’s what it doesn’t do: it won’t improve a bad strategy. If your trading approach has fundamental flaws—poor risk management, no edge, emotional decision-making—knowing when candles close won’t fix that. It’s a timing tool, not a signal generator.
The indicator also can’t predict what happens when the candle closes. You might wait perfectly for a 4-hour candle to close above resistance, only to watch the next candle immediately reverse. The timer gives you precision; it doesn’t guarantee outcomes.
Some traders find the countdown creates pressure. Watching seconds tick down can trigger impulsive behavior—the “I must act before it closes!” mentality. If you’re prone to that, the timer might work against you. In those cases, using chart corner placement instead of next-to-bar reduces the psychological urgency.
Comparing to Alternative Approaches

Without this indicator, traders typically use one of three methods: checking MT5’s server time display and mentally calculating remaining time, using external countdown apps or widgets, or simply estimating based on experience.
Mental calculation works until you’re managing three positions across four currency pairs. Cognitive load increases, mistakes happen. External countdown tools require switching focus away from charts—inefficient when you’re trying to catch fast moves. Estimating based on experience might serve a veteran trader on higher timeframes but creates inconsistency for newer traders or on lower timeframes where seconds matter.
Compared to other MetaTrader utilities like session indicators (which mark trading session times) or market hours tools, the Candle Clock fills a different need. Session indicators tell you when London opens; the Candle Clock tells you when your current bar ends. Both useful, different purposes.
Some all-in-one dashboard indicators include candle countdown as one feature among many (spread, session times, pip value calculators). Those work fine if you want multiple tools in one panel. Standalone candle timers typically offer cleaner displays with less screen clutter—choose based on your preference for simplicity versus comprehensive information.
Practical Installation and Setup
The indicator installs like any MT5 custom tool. Download the file (usually a .ex5 extension), navigate to File > Open Data Folder in MetaTrader 5, open the MQL5 folder, then the Indicators folder, and paste the file. Restart MT5 or refresh the Navigator panel. The indicator appears in your Navigator window under Custom Indicators.
Drag it onto your chart, adjust the input parameters to match your preferences, and you’re set. It auto-syncs across all timeframes, so switching from 15-minute to 4-hour charts requires no additional configuration—the countdown simply adjusts to the new timeframe.
For traders running multiple broker accounts on one computer, you’ll need to install separately for each MT5 instance since each has its own data folder.
When the Countdown Actually Matters
Not every trading style benefits equally. Position traders holding for weeks or months won’t gain much—candle close timing on daily or weekly charts doesn’t require second-by-second precision. Long-term investors can skip this entirely.
Day traders and scalpers get maximum value. When you’re taking 5-15 trades per session on 5-minute or 15-minute charts, consistent timing becomes a performance factor. The difference between entering at the close versus 2 minutes before compounds across dozens of trades weekly.
News traders find it indispensable. Central bank announcements, employment reports, inflation data—these create enormous volatility. Knowing exactly when that first reaction candle closes helps you assess whether the initial move has legs or if it’s just noise.
Traders focused on specific patterns (pin bars, inside bars, engulfing patterns) need it. These patterns only become valid at candle close. The timer prevents premature pattern confirmation.
Recommended MT4/MT5 Broker
XM Broker
- Free $50 To Start Trading Instantly! (Withdraw-able Profit)
- Deposit Bonus up to $5,000
- Unlimited Loyalty Program
- Award Winning Forex Broker
- Additional Exclusive Bonuses Throughout The Year
- Exclusive 90% VIP Cash Rebates for all Trades!


Already an XM client but missing out on cashback? Open New Real Account and Enter this Partner Code: VIP90


