





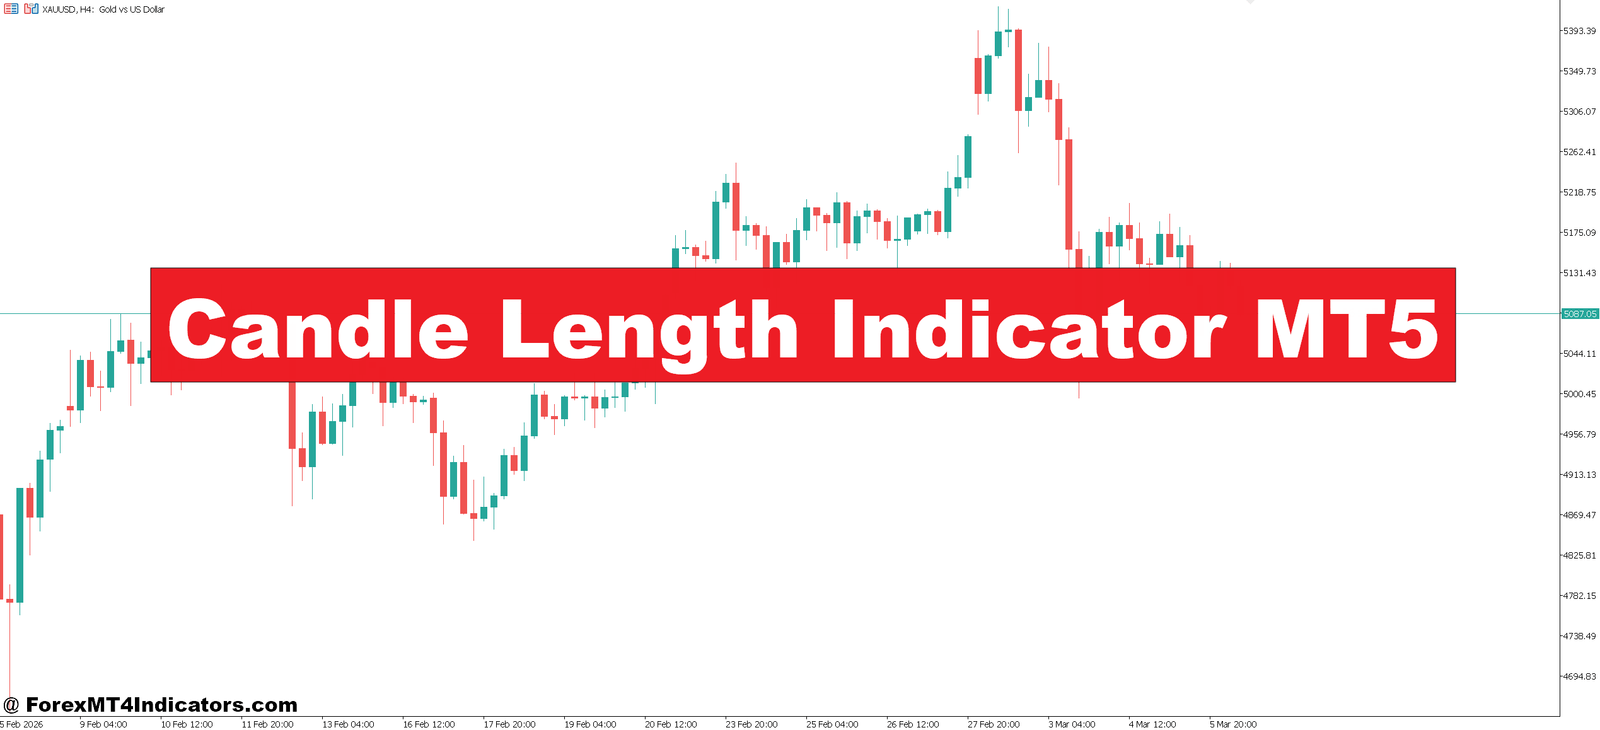
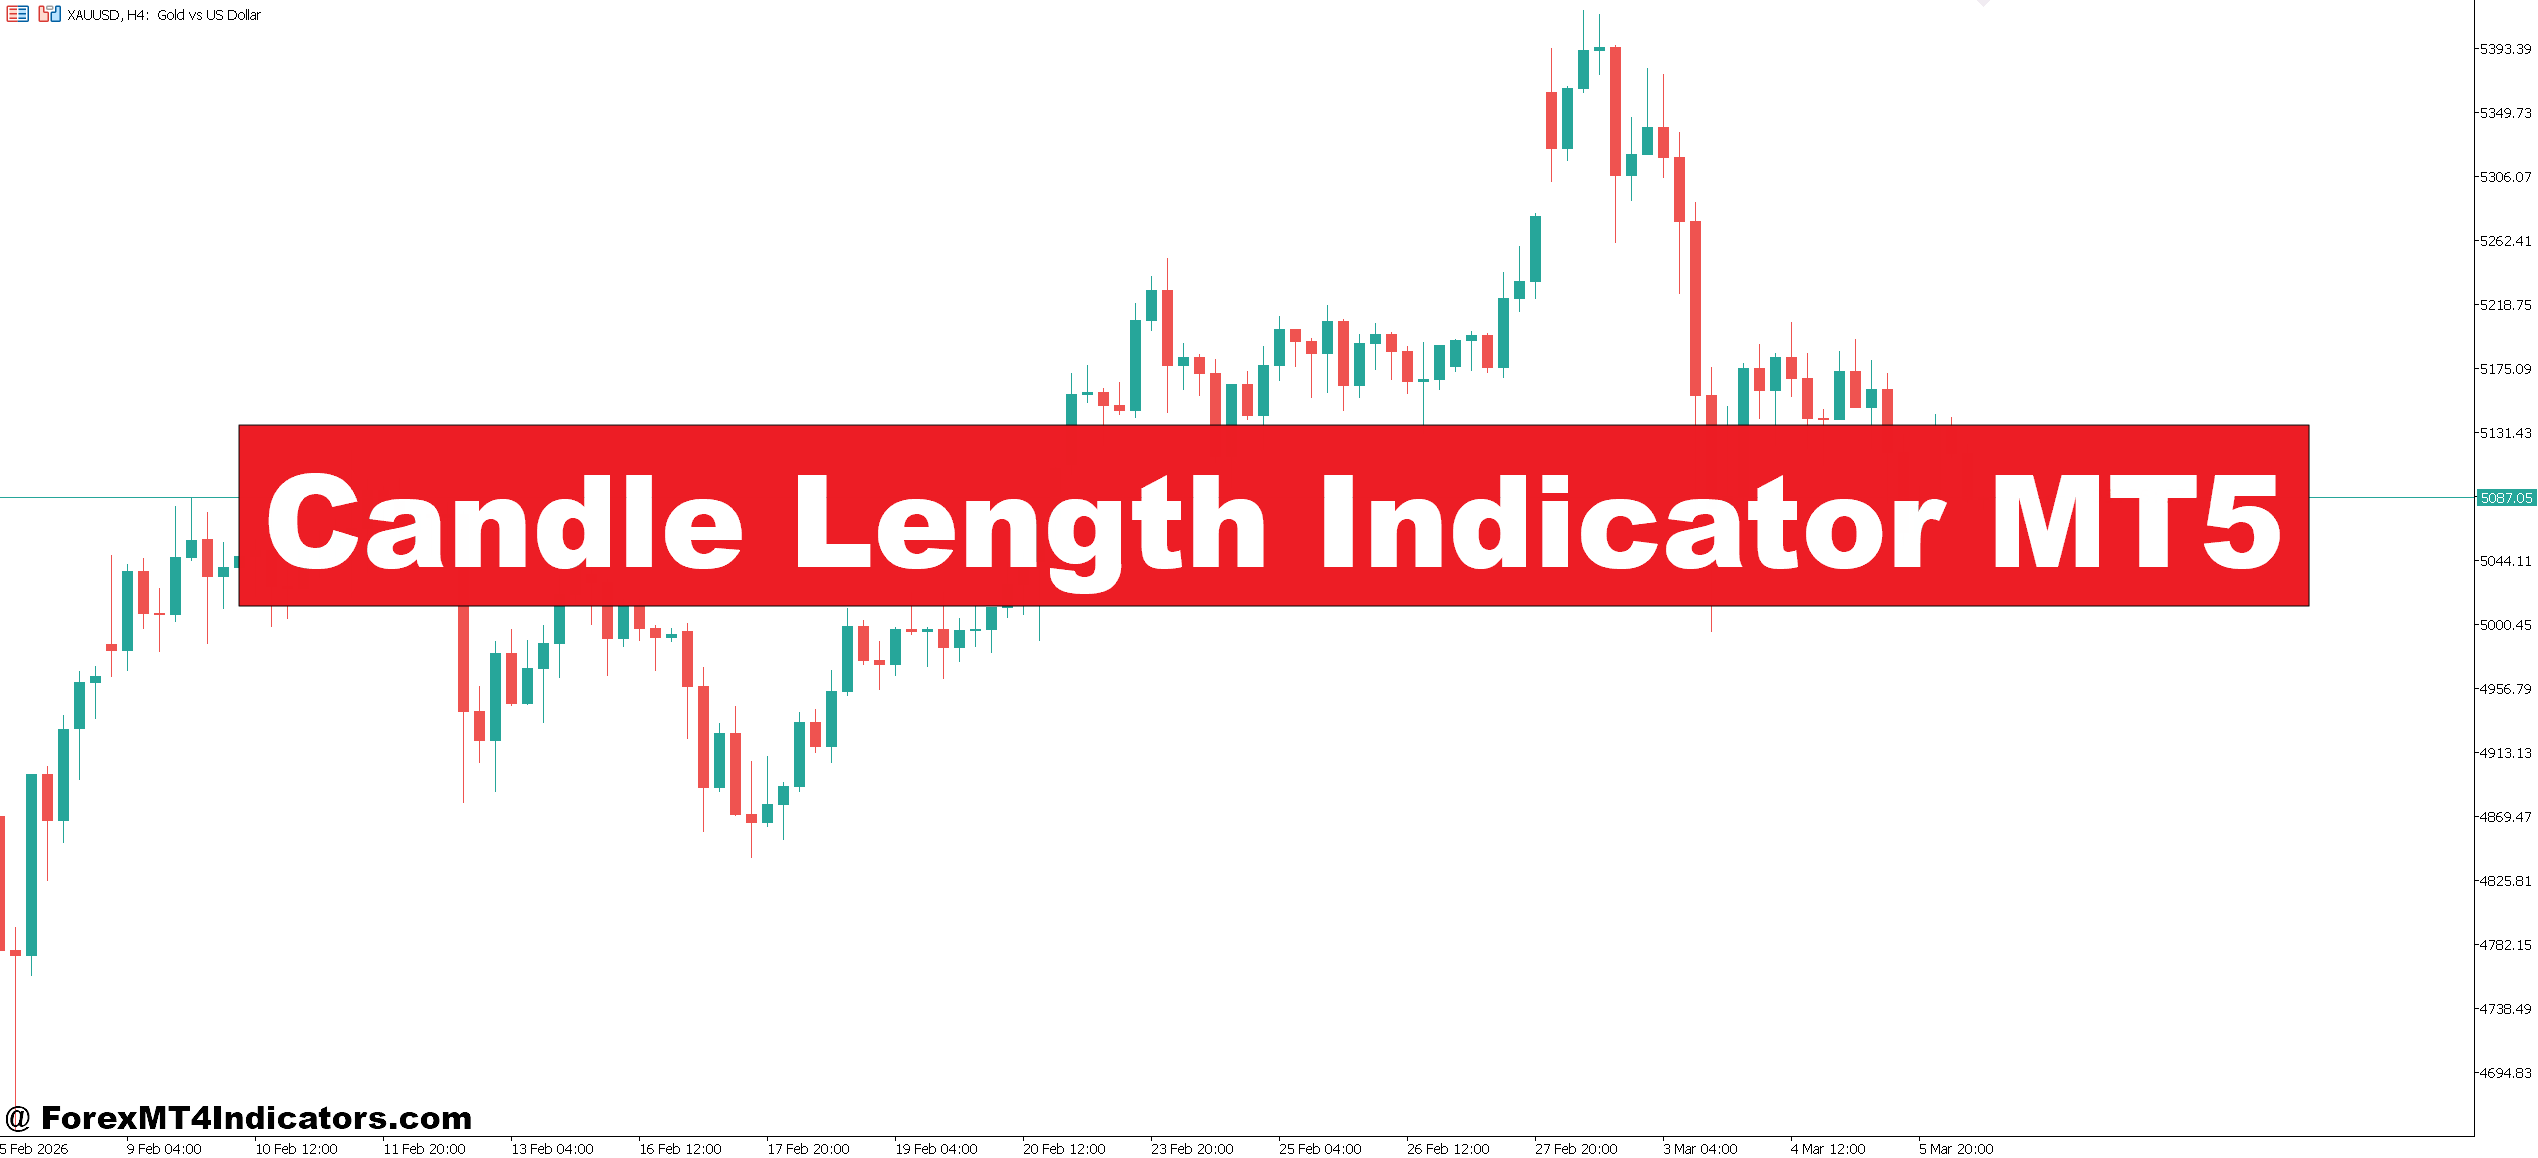
The Candle Length Indicator MT5 was designed to solve this exact issue. Instead of guessing whether a candle is significant, the indicator measures the actual size of each candlestick and highlights those that exceed a defined threshold. This makes it easier to identify strong momentum moves, breakout candles, and potential reversal points.
For traders who rely on price action, this simple tool can add a layer of objective analysis. Understanding how the Candle Length Indicator works—and how to apply it correctly—can improve entry timing and help filter weak market signals.
Understanding the Candle Length Indicator MT5
The Candle Length Indicator MT5 is a technical analysis tool that measures the size of each candlestick on a chart. It calculates the distance between the candle’s high and low and compares it to a predefined value or average range.
In simple terms, the indicator answers a basic question: Is this candle larger than normal?
When a candle exceeds the specified length, the indicator highlights it. Some versions show arrows, colored candles, or signals on the chart. Others may display the measured candle length in pips.
This is especially useful because large candles often appear during:
- Breakouts from support or resistance
- Strong trend continuation
- High volatility events
- Institutional order flow entering the market
For example, while reviewing EUR/USD on the 1-hour chart, traders often see candles averaging 8–12 pips during quiet sessions. If a sudden 35-pip candle appears, it usually signals a shift in market momentum. The Candle Length Indicator helps detect these moves instantly.
But a large candle alone doesn’t guarantee direction. That’s why experienced traders combine the tool with market structure, trend analysis, and support or resistance levels.
How the Indicator Calculates Candle Length
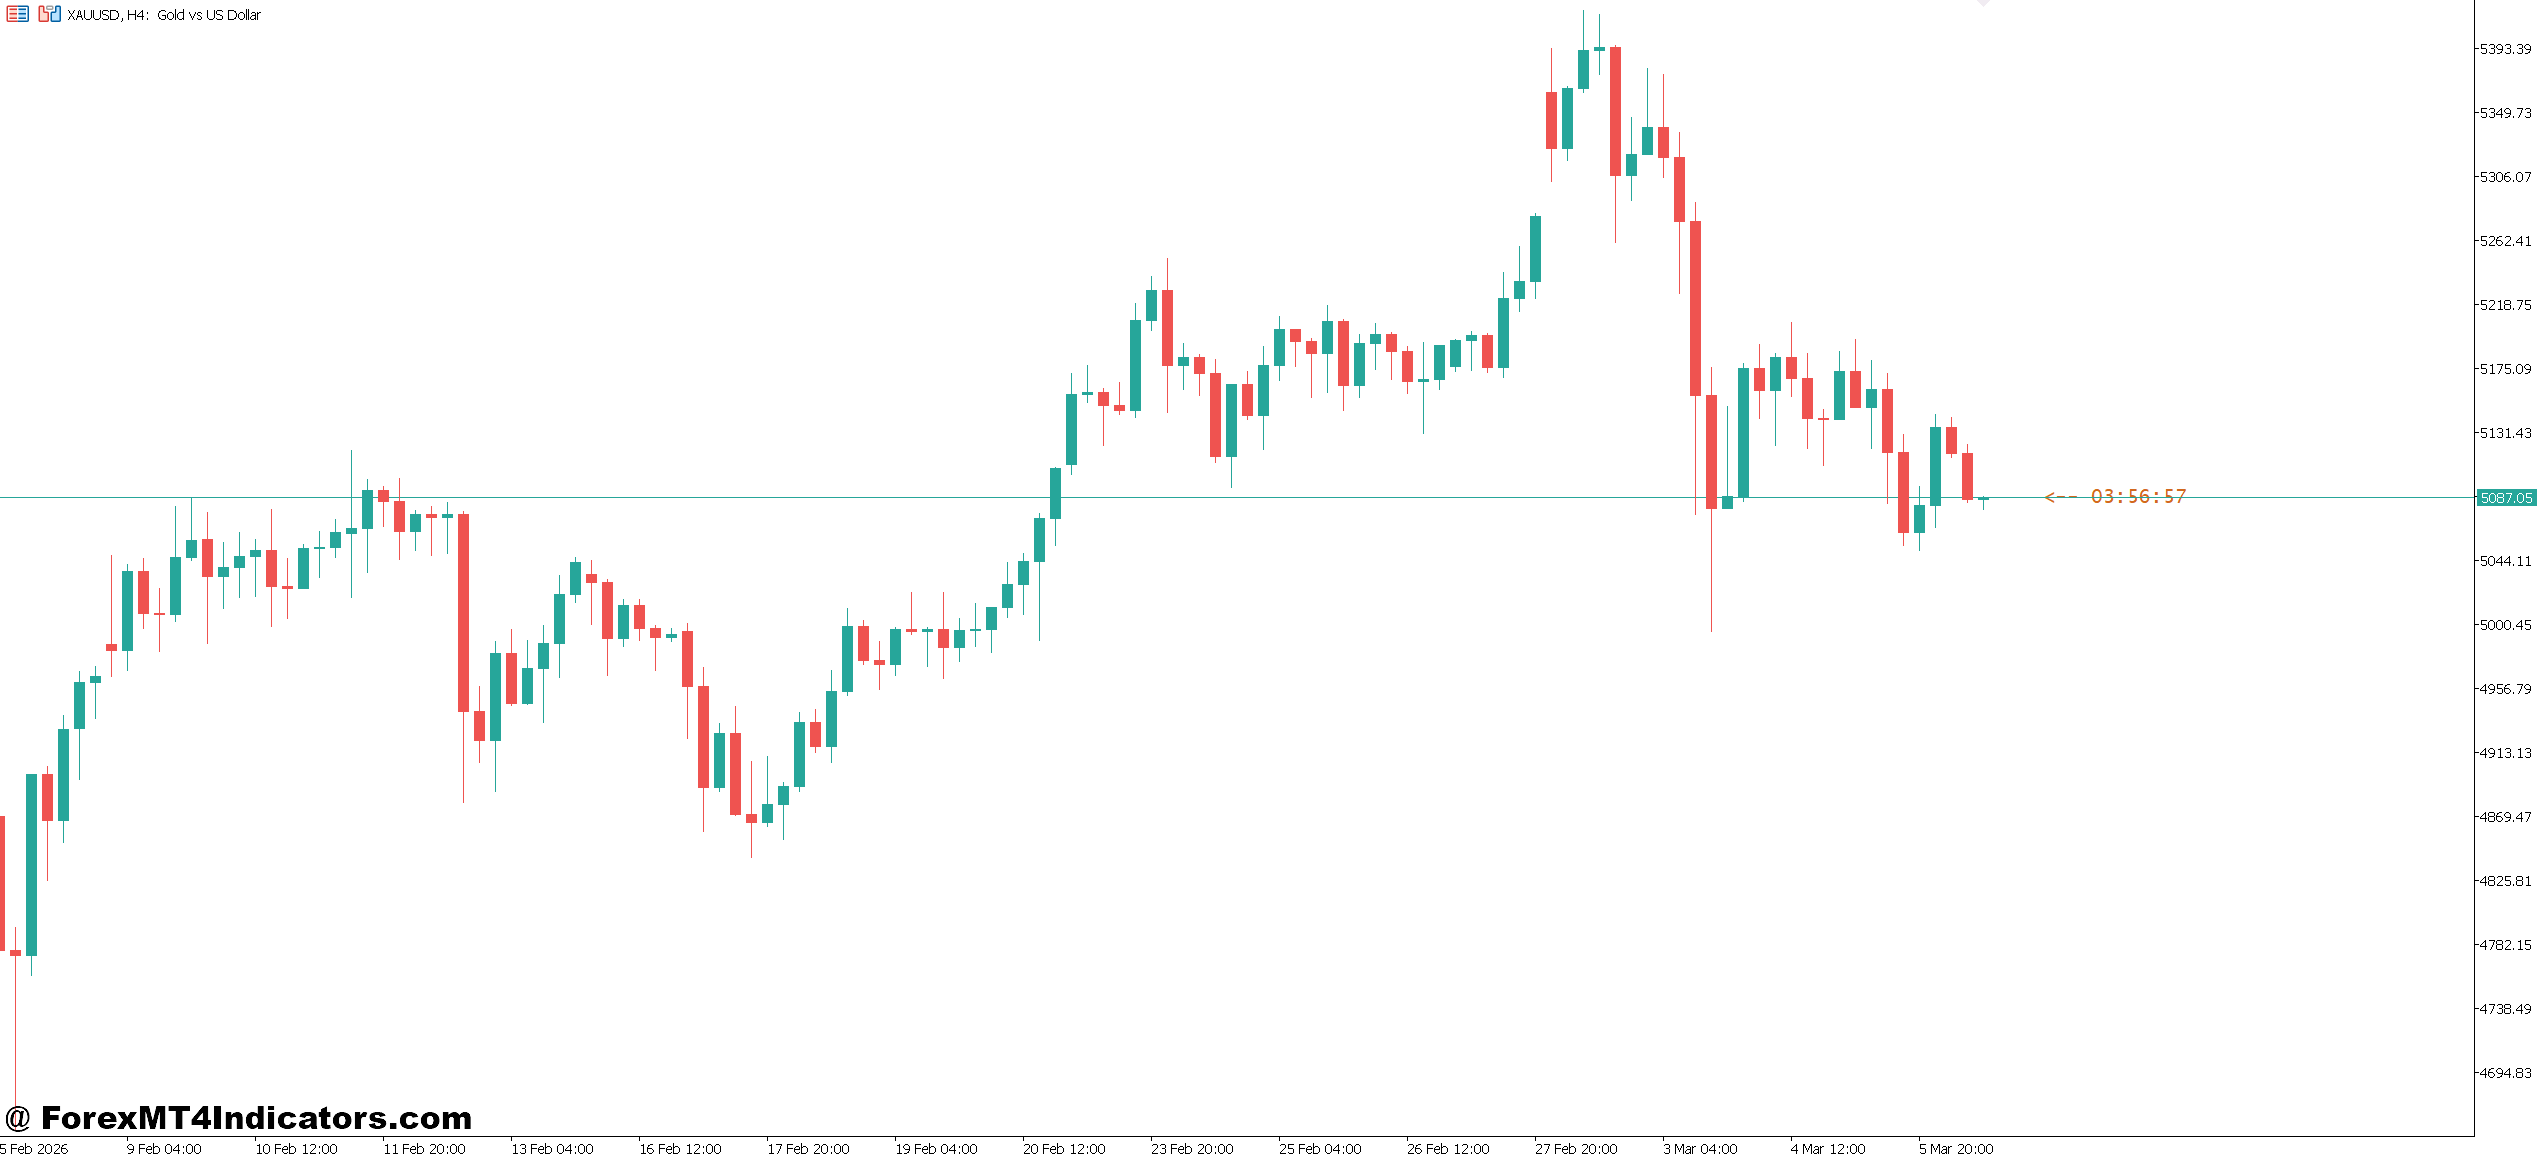
Behind the scenes, the logic is straightforward but effective.
The indicator measures the total range of a candle using this formula:
Candle Length = High Price – Low Price
The result is usually displayed in pips or points.
Many versions also compare the current candle length with a previous average. This is often based on the Average True Range (ATR) or the average size of the last 10–20 candles.
Here’s how the logic typically works:
- The indicator calculates the current candle range.
- It compares the range with the average candle size.
- If the candle exceeds the defined threshold, the indicator marks it on the chart.
For example:
- Average candle size on GBP/USD M30 = 12 pips
- Current candle range = 30 pips
Because the candle is more than double the average, the indicator flags it as a significant move.
During volatile events such as Non-Farm Payroll (NFP) releases, traders often see candle ranges expand dramatically. When testing this indicator during NFP sessions, many candles exceeded 50–70 pips on major pairs. The indicator makes these spikes immediately visible.
Still, experienced traders avoid trading blindly on these signals. News-driven candles can reverse quickly.
Practical Trading Applications
The Candle Length Indicator becomes powerful when combined with price action and market structure.
Breakout Confirmation
Large candles frequently appear when price breaks a key level.
Consider EUR/USD on the H1 chart approaching resistance at 1.0850. For several hours, candles remain small, around 10 pips. Suddenly, a 35-pip bullish candle closes above the level.
When the Candle Length Indicator highlights that candle, it confirms strong buying pressure. Many traders would then wait for a small pullback before entering a buy position.
Momentum Trend Entries
Strong trends usually show expanding candles in the direction of the trend.
During a USD/JPY uptrend on the 4-hour chart, traders may notice multiple candles exceeding 40 pips. When the indicator repeatedly highlights these candles, it suggests the trend still has momentum.
A trader might enter after a minor retracement instead of chasing the initial move.
Reversal Warning
Large candles can also appear at the end of trends.
For instance, on GBP/USD M15, after a long bearish move, a sudden 50-pip bullish candle forms near a support level. The indicator marks the candle as unusually large.
This doesn’t confirm a reversal, but it warns traders that selling pressure may be weakening.
That kind of signal often appears during liquidity sweeps or stop hunts.
Candle Length Indicator MT5 Indicator Settings
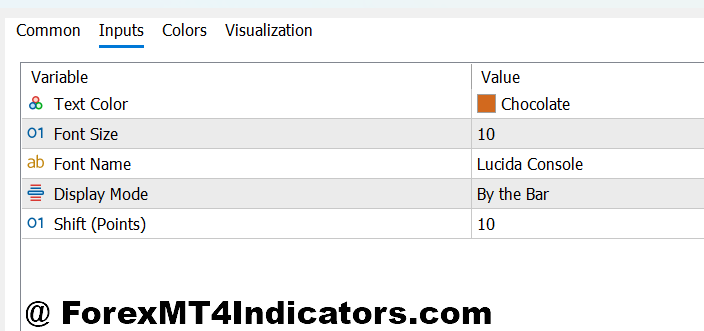
Most versions of the Candle Length Indicator MT5 allow traders to adjust parameters based on their strategy.
Common settings include:
Minimum Candle Size
Traders define the minimum candle length that triggers a signal. For example:
- 20 pips for H1 charts
- 10 pips for M15 charts
- 50 pips for daily charts
Average Period
Some versions calculate average candle size over a period, such as:
- 10 candles
- 14 candles
- 20 candles
Shorter periods react faster to volatility changes.
Visual Alerts
The indicator may highlight candles using:
- Color changes
- Arrows
- On-chart labels
- Push alerts
Scalpers often prefer bright visual markers on lower timeframes.
In practice, traders adjust settings depending on the pair. GBP/JPY, for example, naturally produces larger candles than EUR/CHF. Using the same threshold for both pairs can create misleading signals.
Advantages and Limitations
Like any technical indicator, this tool has strengths and weaknesses.
Advantages
Simple interpretation: The concept is easy to understand. A large candle usually signals strong momentum or volatility.
Useful for breakout trading: The indicator helps confirm when price moves beyond consolidation zones.
Works well with price action: Traders who rely on support, resistance, and trend structure often find this indicator helpful.
Effective volatility filter: It quickly reveals when the market shifts from quiet conditions to active movement.
Limitations
Large candles can be traps: Sometimes a big candle forms due to news spikes. Price may reverse immediately afterward.
Not a standalone trading system: The indicator only measures candle size. It does not analyze trend direction or market context.
Different pairs behave differently
What counts as a large candle on EUR/USD may be normal on GBP/JPY.
Because of these factors, traders typically combine the Candle Length Indicator with tools like moving averages, RSI, or support and resistance levels.
And of course, one critical reminder applies to every trading strategy:
Trading forex carries substantial risk. No indicator guarantees profits.
Conclusion
The Candle Length Indicator MT5 offers a straightforward way to measure market momentum through candlestick size. Instead of relying on visual guesswork, traders can quickly identify when price movement exceeds normal volatility.
Key takeaways include the ability to spot momentum candles during breakouts, recognize volatility expansion during trends, and detect unusual price activity near key support or resistance levels. Many traders use the indicator as a confirmation tool rather than a primary signal generator.
Still, candle size alone cannot predict future direction. Market structure, trend analysis, and proper risk management remain essential parts of any trading strategy.
Used with discipline, the Candle Length Indicator MT5 can help traders read price action more clearly and make more informed decisions when volatility suddenly increases.
Recommended MT4/MT5 Broker
XM Broker
- Free $50 To Start Trading Instantly! (Withdraw-able Profit)
- Deposit Bonus up to $5,000
- Unlimited Loyalty Program
- Award Winning Forex Broker
- Additional Exclusive Bonuses Throughout The Year
- Exclusive 90% VIP Cash Rebates for all Trades!


Already an XM client but missing out on cashback? Open New Real Account and Enter this Partner Code: VIP90
(Free MT4 Indicators Download)




