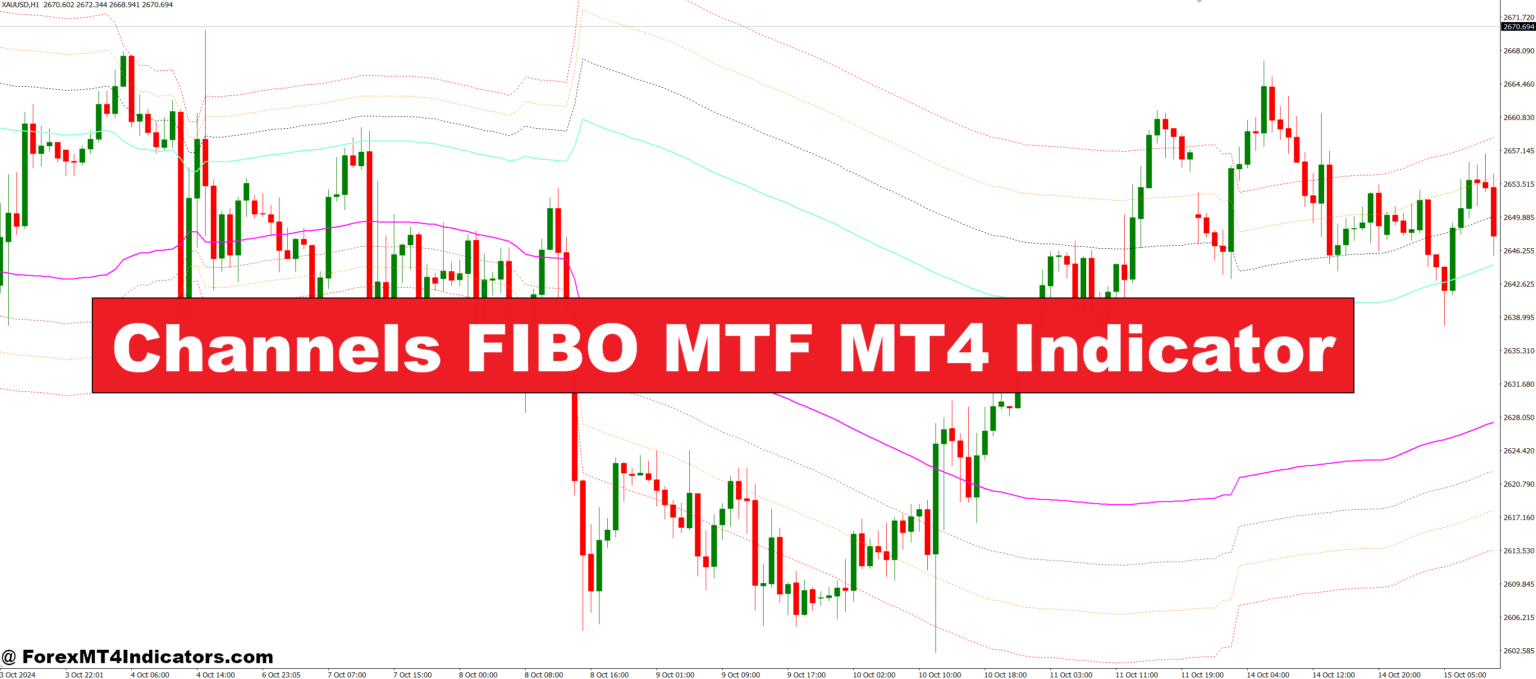
The Channels FIBO MTF MT4 Indicator is designed to help traders visualize channel zones created using Fibonacci ratios. What makes it stand out is its ability to pull data from different timeframes and display them on a single chart. This means you can see the H1, H4, or even D1 channel lines while trading on M15 or M5, giving a much broader market view. It’s especially useful for swing and intraday traders who want to align short-term moves with long-term trends.
How It Draws Powerful Support and Resistance
This indicator uses the well-known Fibonacci levels to draw channels, which naturally identify areas where price may react. The upper and lower bands of the channel act as dynamic support and resistance zones, while the center line often becomes a key decision point. These levels are not random—they reflect real market behavior and can guide traders in predicting reversals or continuations. Plus, since they adapt to different timeframes, they help filter out noise and highlight high-probability zones.
Easy Setup, Strong Visual Feedback
Installing the Channels FIBO MTF Indicator is simple, and once it’s applied to a chart, it immediately begins drawing levels based on the selected timeframe. Traders can customize colors, line thickness, and which timeframes they want to display. The clear visual representation helps traders stay focused and reduces decision fatigue. Instead of switching between charts, everything is visible at once, saving time and boosting clarity during fast market conditions.
How to Trade with Channels FIBO MTF MT4 Indicator
Buy Entry
- Wait for the price to approach or touch the lower Fibonacci channel line from a higher timeframe (e.g., H1 or H4).
- Check if a bullish candlestick pattern forms near the lower channel (e.g., hammer, engulfing).
- Confirm that the overall trend (from higher timeframes) is upward or sideways.
- Enter a buy trade when the price starts bouncing from the lower channel zone.
- Place a stop-loss just below the recent swing low or the lower channel boundary.
- Target the middle or upper channel line as your take-profit zone.
Sell Entry
- Wait for the price to reach or touch the upper Fibonacci channel line from a higher timeframe.
- Look for a bearish reversal candlestick pattern (e.g., shooting star, bearish engulfing).
- Confirm that the market trend is either downward or showing signs of exhaustion.
- Enter a sell trade when price starts rejecting the upper channel zone.
- Place a stop-loss just above the recent swing high or the upper channel boundary.
- Aim for the middle or lower channel line as your take-profit level.
Conclusion
The Channels FIBO MTF MT4 Indicator gives traders a reliable way to analyze the market using Fibonacci channels across multiple timeframes. It’s a time-saving, clarity-boosting tool that helps spot stronger setups and avoid false signals. Whether you’re a beginner or an experienced trader, this indicator can give you an edge by combining simplicity with deeper insight. Add it to your chart and start trading with a more confident strategy today.
Recommended MT4/MT5 Broker
XM Broker
- Free $50 To Start Trading Instantly! (Withdraw-able Profit)
- Deposit Bonus up to $5,000
- Unlimited Loyalty Program
- Award Winning Forex Broker
- Additional Exclusive Bonuses Throughout The Year
- Exclusive 50% Cash Rebates for all Trades!
Already an XM client but missing out on cashback? Open New Real Account and Enter this Partner Code: 𝟕𝐖𝟑𝐉𝐐


