


AUD/CAD has formed lower highs and higher lows to consolidate inside a symmetrical triangle formation.
Is it due for a breakout soon?
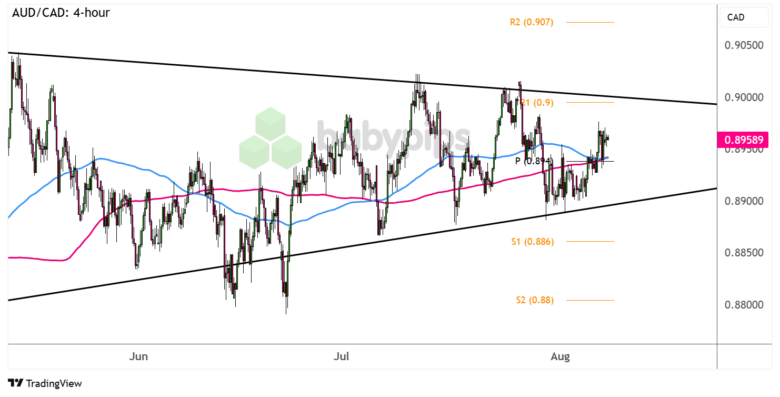
Here are the support and resistance zones I’m watching on the 4-hour chart.
AUD/CAD 4-hour Forex Chart by TradingView
This comdoll cross is still hovering around the middle of its triangle pattern, following a bounce off support and possibly setting its sights on the resistance at R1 (.9000) and a major psychological mark.
Weaker crude oil prices appear to be weighing on the Canadian dollar so far, as some signs of progress between US-Russia talks are easing global supply concerns while additional U.S. tariffs threats are clouding the demand outlook.
Can AUD/CAD go for a bullish breakout next?
Remember that directional biases and volatility conditions in market price are typically driven by fundamentals. If you haven’t yet done your fundie homework on the Australian dollar and the Canadian dollar, then it’s time to check out the economic calendar and stay updated on daily fundamental news!
The pair is also trading above the dynamic support at the moving averages, suggesting that bulls have the upper hand for now. Look out for sustained upside pressure taking AUD/CAD past the triangle top, as this could lift it up to the next upside targets at R2 (.9070) then the .9100 major psychological resistance.
On the other hand, reversal candlesticks forming near the triangle top could suggest that the consolidation is bound to carry on. In this case, keep an eye out for a dip back to nearby support zones at the pivot point level (.8940) then the triangle bottom close to the .8900 handle.
Whichever bias you end up trading, don’t forget to practice proper risk management and stay aware of top-tier catalysts that could influence overall market sentiment.
Disclaimer:
Please be aware that the technical analysis content provided herein is for informational and educational purposes only. It should not be construed as trading advice or a suggestion of any specific directional bias. Technical analysis is just one aspect of a comprehensive trading strategy. The technical setups discussed are intended to highlight potential areas of interest that other traders may be observing. Ultimately, all trading decisions, risk management strategies, and their resulting outcomes are the sole responsibility of each individual trader. Please trade responsibly.


