


Missed the breakouts on EUR/GBP and USD/CHF?
Both pairs still seem ready for quick pullbacks, so don’t miss ’em!
EUR/GBP 4-hour Forex Chart by TradingView
Reversal alert!
EUR/GBP busted through the top of its descending channel visible on the 4-hour time frame, indicating that an uptrend is in the works.
But before euro bulls take the pair any higher, a retest of the former resistance zone might take place.
The Fibonacci retracement tool shows that area is spanned by the 38.2% to 50% levels where more buyers might be hanging out.
Technical indicators are pointing to a continuation of the climb, as the 100 SMA just crossed above the 200 SMA.
Also, the 100 SMA dynamic support coincides with the 38.2% level at the .8750 minor psychological level to add to its strength as a floor.
Stochastic looks ready to pull higher, but the oscillator has a bit more room to move south before indicating oversold conditions or exhaustion among sellers.

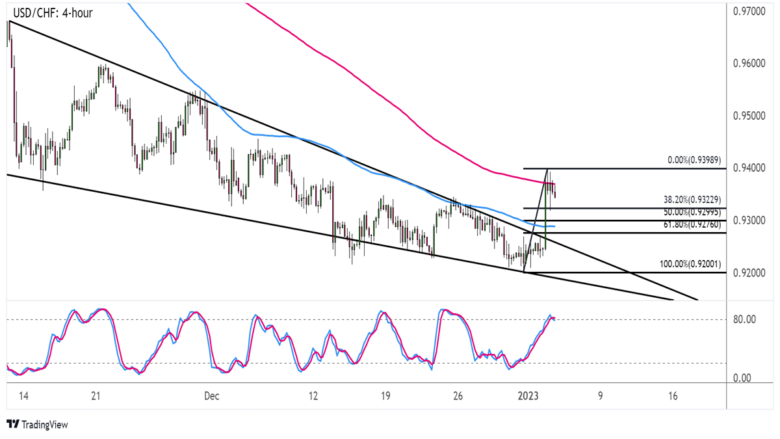
USD/CHF 4-hour Forex Chart
Looking to hop in this bullish wedge breakout?
USD/CHF might be in for a rally that’s at least the same height as the chart formation, but buyers might need a quick dip back to the former resistance to gather more bullish pressure.
Stochastic is still indicating overbought conditions after all, so sellers might return while bulls are taking a break.
Applying the Fib tool on the breakout move shows that this area lines up with the 61.8% retracement level near the .9300 major psychological support.
Just be careful since the 100 SMA is still below the 200 SMA to suggest that there’s a chance the selloff could carry on. Then again, the gap between the indicators is narrowing to hint at a potential bullish crossover.
If you’re feeling cautious about this one, better wait for additional confirmation from moving averages or for Stochastic to reach oversold levels before going long!


