


Is the trend still our friend on these charts or are we about to see the bend at the end?
Check out these channels on AUD/JPY and the S&P 500 index!
This pair is already testing the very top of its descending channel on the 4-hour time frame!
Will we see a bounce or a break this time?
Technical indicators are pointing to a continuation of the slide on AUD/JPY, as the 100 SMA is below the 200 SMA while Stochastic has some room to head lower.
This means that bearish pressure is still in play, possibly taking the pair down to the bottom of the channel at 91.00 from here. The 100 SMA even lines up with the channel top to add to its strength as a ceiling.
However, Stochastic appears to be changing its mind and turning slightly higher to reflect slight bullish vibes.
If AUD/JPY makes another test of resistance and manages to bust through the 93.00 handle, we just might see an uptrend forming on this one!

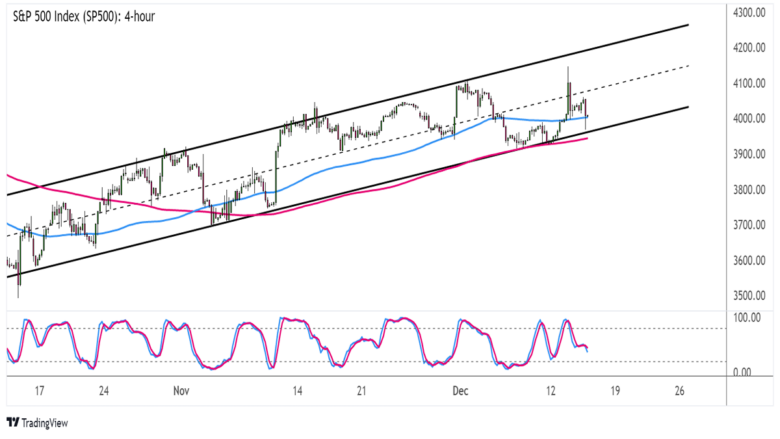
S&P 500 Index (SP500) 4-hour Chart
Is the S&P 500 index rally losing steam?
The equity index hit a roadblock at the mid-channel area of interest and is back down to the ascending channel support once more.
Moving averages are hinting that the floor is more likely to hold than to break, as the 100 SMA is above the 200 SMA to signal upside momentum.
At the same time, the 200 SMA coincides with the bottom of the channel. If support holds, the index could recover to the top of the channel or at least until the latest highs near 4200.
However, Stochastic is heading south to reflect bearish pressure, so price could follow suit until oversold conditions are met.
If that’s the case, AUD/JPY could fall through the channel bottom and go for a reversal from the climb.
Better keep your eyes peeled for bearish candlesticks closing below 4000 then!


