


NZD/CHF is catching a bounce from a key support area, right as the SMAs start pointing to a possible shift higher.
Will NZD/CHF retest higher areas of interest in the next few days?
We’re taking a closer look at the 4-hour time frame!
NZD/CHF 4-hour Forex Chart by TradingView
The New Zealand dollar struggled last week after a hotter-than-expected U.S. PPI print cooled Fed rate cut hopes and gave the Greenback a lift. Add in soft New Zealand data and growing expectations for an RBNZ rate cut, and it’s no surprise the comdoll took a hit.
On the flip side, the Swiss franc held firm. Traders looking for safety in a shaky global growth backdrop made worse by rising tariffs kept the franc supported, especially with U.S. dollar strength fading later in the week.
Remember that directional biases and volatility conditions in market price are typically driven by fundamentals. If you haven’t yet done your fundie homework on the New Zealand dollar and the Swiss franc, then it’s time to check out the economic calendar and stay updated on daily fundamental news!
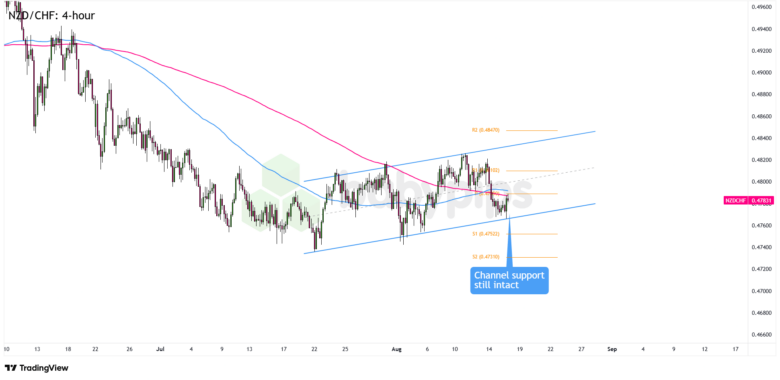
Still, even with the weak fundamentals, NZD/CHF held its ground at the .4775 support area. That level lines up with the bottom of an ascending channel pattern, which has been in play since late July.
What makes the setup more compelling is the 100 SMA just crossed above the 200 SMA, a bullish signal that often marks the start of a trend reversal. It adds confirmation that NZD/CHF’s recent higher highs and higher lows may not just be a short-term bounce, but a potential shift in momentum after months of selling earlier this year.
If we see more green candlesticks and a solid move above the Pivot Point at .4789, NZD/CHF could revisit its .4825 highs or even push toward the .4850 inflection zone.
But if the pair sees sustained trading below the 100 and 200 SMAs, it could break out of the channel to the downside. That opens the door for a pullback toward the .4750 S1 support, or possibly even the .4700 psychological level.
Whichever bias you end up trading, don’t forget to practice proper risk management and stay aware of top-tier catalysts that could influence overall market sentiment.
Disclaimer:
Please be aware that the technical analysis content provided herein is for informational and educational purposes only. It should not be construed as trading advice or a suggestion of any specific directional bias. Technical analysis is just one aspect of a comprehensive trading strategy. The technical setups discussed are intended to highlight potential areas of interest that other traders may be observing. Ultimately, all trading decisions, risk management strategies, and their resulting outcomes are the sole responsibility of each individual trader. Please trade responsibly.


