






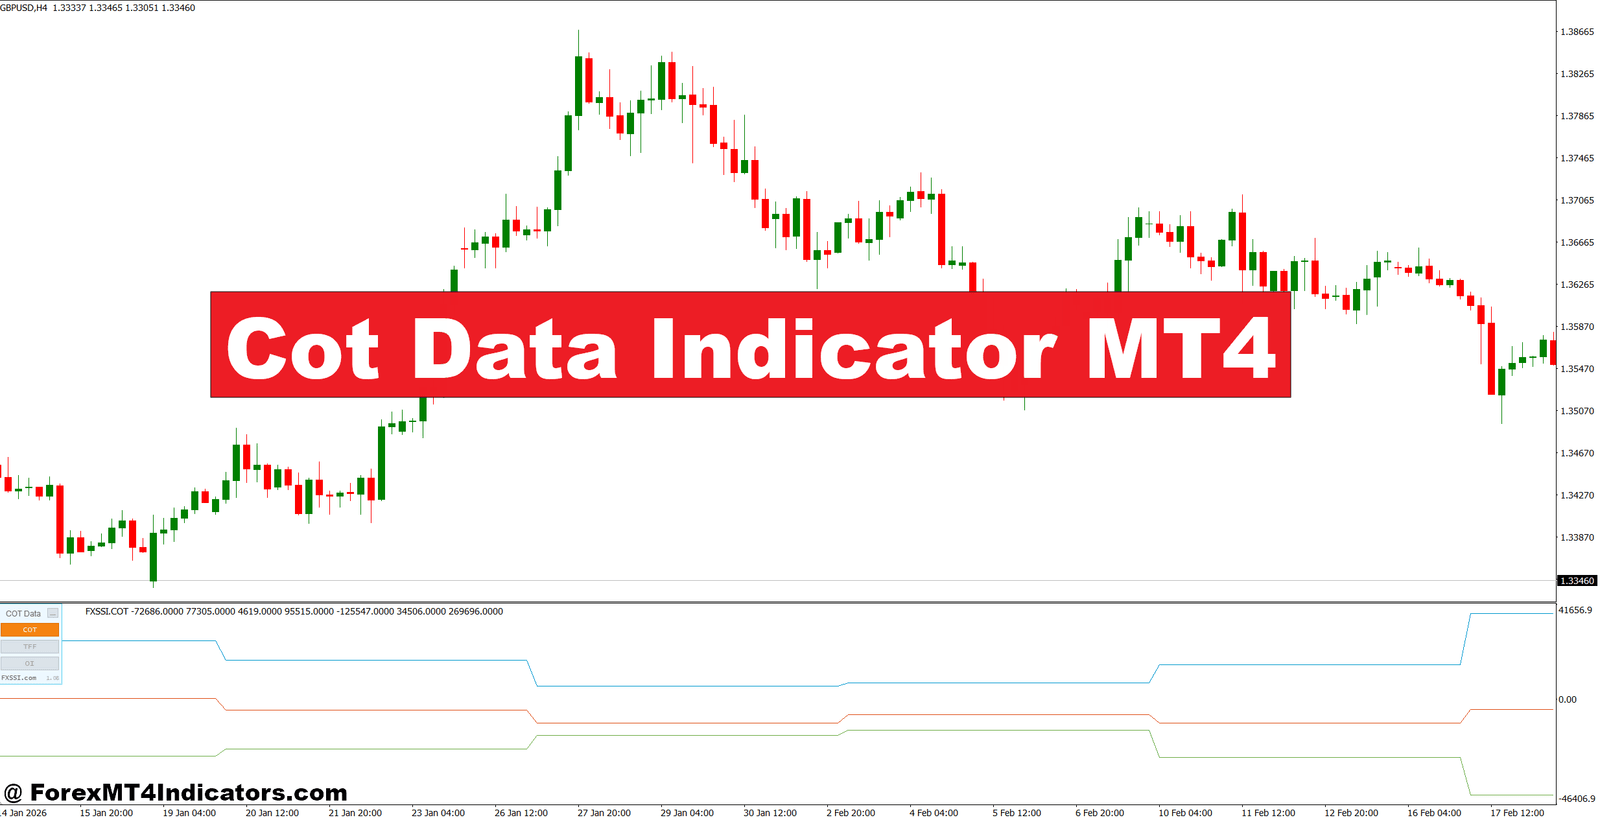
The COT Data Indicator MT4 can help add that missing layer of market context. It brings Commitment of Traders data onto an MT4 chart, allowing traders to study how major futures-market participants are positioned. It isn’t an entry system by itself, but it can strengthen trend confirmation, support/resistance analysis, and longer-term trade planning.
Here’s how traders can use it without treating positioning data as a magic signal.
What Is the COT Data Indicator MT4?
The COT Data Indicator MT4 is a technical-analysis tool that displays data derived from the weekly Commitment of Traders (COT) report published by the U.S. Commodity Futures Trading Commission (CFTC).
The report breaks futures positions into trader categories. For forex analysis, traders commonly focus on Non-Commercial positions, which broadly represent large speculative participants such as hedge funds and other institutional traders. Commercial positions are also useful because they represent participants with commercial exposure to the underlying market.
The indicator may display figures such as:
- Long contracts
- Short contracts
- Net position
- Changes in positioning
- Historical positioning levels
One key point matters here: COT data comes from futures markets, not the spot forex market. So a trader analyzing EUR/USD is generally using the COT positioning for euro futures as a broader measure of sentiment.
That distinction prevents a common mistake. The indicator doesn’t show every position in the global forex market.
How COT Data Works in MT4
COT analysis is based on positioning rather than price alone. The basic calculation is straightforward:
Net Position = Long Contracts − Short Contracts
For example, suppose the latest report shows:
- Non-commercial longs: 210,000
- Non-commercial shorts: 145,000
- Net position: +65,000
The positive figure suggests large speculators hold more long than short contracts.
Now imagine the previous week’s net position was +48,000. The increase to +65,000 means speculative positioning became more bullish by 17,000 contracts.
That change can be more useful than simply seeing a large positive number.
Reading Changes in Positioning
A trader should compare current COT figures with previous weeks instead of reacting to one reading.
For example, EUR/USD may trade around 1.0850 while speculative euro positioning rises from +25,000 to +55,000 contracts over several weeks. If price also breaks above a major resistance zone around 1.0900, the two pieces of information support the same bullish idea.
But if price rises from 1.0800 to 1.0950 while net positioning falls from +80,000 to +35,000 contracts, caution makes more sense. Price is moving higher, but large speculative exposure is weakening.
That’s where COT data becomes useful as confirmation rather than an isolated signal.
Practical COT Trading Examples
Consider a trader watching GBP/USD on the 4-hour chart. Price breaks above 1.2700 after spending several sessions below resistance. The trader checks COT data and sees speculative net GBP positioning increasing for three consecutive reports.
Instead of immediately buying the breakout, the trader waits for price to retest 1.2700. If that level holds and a bullish candle forms, an entry around 1.2720 could be considered. A stop 35 pips lower near 1.2685 gives the setup defined risk.
The COT reading doesn’t trigger the trade. The price structure does. COT simply provides additional directional context.
Another example is USD positioning. Suppose speculative dollar exposure becomes heavily bullish while USD/JPY reaches a well-established resistance zone near 150.00. Price then prints a bearish rejection candle on the daily chart.
That combination deserves attention because positioning is already stretched while price is struggling at resistance. A trader might wait for a break below a nearby 149.40 support level before considering a short rather than selling immediately at 150.00.
When testing COT-based ideas around volatile events such as NFP, traders should be even more careful. A strong employment report can move a major pair 80–150 pips quickly, while the weekly COT reading won’t update fast enough to reflect that new information.
Settings, Timeframes, and Pair Selection
The exact settings depend on how the particular MT4 indicator was coded. Some versions offer options for trader categories, display modes, historical periods, and smoothing. Traders should understand those inputs before changing them.
For swing trading, weekly COT information fits naturally with 4-hour and daily charts. A trader looking at EUR/USD, GBP/USD, AUD/USD, or USD/JPY can use the positioning data to form a directional bias and then use lower timeframes for execution.
A practical approach could look like this:
- Daily chart: identify the broader trend and major support/resistance.
- 4-hour chart: look for a structure break or pullback.
- 1-hour chart: refine the entry after confirmation.
- COT report: assess whether large speculative positioning supports or conflicts with the idea.
Lower timeframes such as M1 or M5 aren’t ideal for interpreting weekly COT changes. A five-minute chart can move 20 pips in minutes while the positioning data remains unchanged until the next report.
The same principle applies to pairs. COT data is especially useful when the corresponding futures market has meaningful participation. Traders should also account for the difference between futures positioning and spot forex pricing.
Strengths and Limitations of COT Analysis
The biggest advantage is context. Traditional indicators such as RSI, MACD, and moving averages primarily respond to price. COT data gives traders another perspective by showing how reported futures-market positioning has changed.
It can also help identify potentially crowded trades. Suppose speculative long positioning in a currency reaches an unusually high historical level. That doesn’t automatically mean price must fall. But if price is also approaching major resistance and momentum is weakening, the trader has a reason to reduce aggressive entries.
There are clear limitations, though.
COT data is weekly, so it isn’t designed for rapid intraday decisions. There is also a reporting delay. The figures represent positions from a specific reporting period, not live institutional exposure.
And extreme positioning can stay extreme for a long time. A currency can remain heavily net-long while continuing to rise another 500 pips. Traders who short simply because positioning looks crowded can get caught in a painful trend.
This is why support/resistance, market structure, price action, and risk management still matter.
COT vs Other Forex Indicators

COT differs from the 14-period RSI because RSI measures recent price momentum, while COT focuses on reported futures positioning.
Moving averages are useful for identifying trend direction, but they don’t show who is positioned in the futures market. MACD can help assess momentum and trend changes, yet it also relies entirely on price-derived calculations.
COT also differs from tick volume. Tick volume measures the number of price changes recorded by a broker during a period. COT positioning provides weekly information about reported futures contracts held by specific trader categories.
The strongest approach isn’t choosing one indicator over another. A trader might use a daily 50-period moving average for trend direction, support/resistance for structure, RSI for momentum, and COT data for broader positioning.
That combination gives more context without forcing every trade to depend on one reading.
How to Trade with Cot Data Indicator MT4
Buy Entry
- Confirm bullish COT positioning – Look for rising net-long positions for at least 2–3 weekly reports before considering buys.
- Wait for a support bounce – On EUR/USD 4-hour, consider buying after a bullish rejection from support with a 20–30 pip stop.
- Use a daily trend filter – Prefer BUY signals when price stays above the 50-day moving average and COT positioning supports the currency.
- Enter after H1 confirmation – On GBP/USD 1-hour, wait for a higher high and higher low before entering after a COT-supported setup.
- Target 1:2 risk-reward – With a 25-pip stop, aim for at least 50 pips of potential profit.
- Avoid extreme chasing – Don’t buy after a 100+ pip rally without a pullback, even when COT positioning remains bullish.
- Reduce risk before news – Keep risk near 0.5–1% per trade around NFP, CPI, or central-bank decisions.
- Skip conflicting setups – Don’t BUY when daily price action is bearish and COT positioning has weakened for several weeks.
Sell Entry
- Confirm bearish COT positioning – Look for declining net-long or increasing net-short positions across 2–3 weekly reports.
- Sell from resistance – On EUR/USD 4-hour, consider a short after rejection from resistance with a 20–35 pip stop.
- Check the daily trend – Favor SELL setups when price remains below the 50-day moving average and positioning supports the bearish bias.
- Use H1 structure breaks – On GBP/USD 1-hour, wait for a lower low followed by a failed retest before entering.
- Set realistic targets – A 30-pip stop should ideally support a 60-pip or larger target for a 1:2 risk-reward ratio.
- Don’t short strong breakouts – Avoid selling immediately after a 70–100 pip bullish breakout simply because COT positioning looks bearish.
- Limit exposure during news – Risk no more than 0.5–1% when major economic releases could cause sharp reversals.
- Skip weak confirmation – Don’t SELL when price is strongly bullish on the daily chart and COT positioning is turning more positive.
Final Thoughts on the COT Data Indicator MT4
The COT Data Indicator MT4 can be useful for traders who want to understand market positioning beyond ordinary price-based indicators.
- Use COT for context: It can show whether speculative positioning is strengthening or weakening.
- Confirm with price: Breakouts, pullbacks, support/resistance, and market structure should still drive the actual setup.
- Respect the timeframe: Weekly positioning data is better suited to swing and position trading than M1 or M5 scalping.
- Watch extreme readings carefully: Crowded positioning can remain extreme while price continues trending.
The best use of COT data is not to predict the next candle. It is to ask whether the broader positioning supports the trade already forming on the chart. Traders who combine that information with sensible stops and controlled position sizes can make better-informed decisions without pretending the indicator can predict the market.
Trading forex carries substantial risk. No indicator guarantees profits. COT data should be tested on historical charts and used as one part of a wider trading plan, not as a standalone buy or sell trigger.
Level up your trading
Learn to read the chart — not just the indicator
eBook · Instant PDF
The Candlestick Playbook
Read and trade 40+ candlestick patterns — with exact entries, stops and exits.
Video Course · 12 modules
The Price Action Masterclass
Read clean charts the no-indicator way — pin bars, support & resistance, entries and exits.
Recommended MT4/MT5 Brokers
XM
- ✓ *FREE *$50 to start (withdrawable)
- ✓ Deposit bonus up to $5,000
- ✓ Negative balance protection
Trading forex and CFDs carries a significant risk of loss and is not suitable for everyone. Broker links are affiliate links — we may earn a commission at no cost to you.
Free MT4 Indicator Download


