


Delta volume calculates the net difference between uptick volume and downtick volume for each bar. Here’s how it works: When price closes higher than the previous tick, that volume gets marked as buying pressure. When price closes lower, it’s selling pressure. The indicator subtracts selling volume from buying volume, giving you a positive or negative delta for each period.
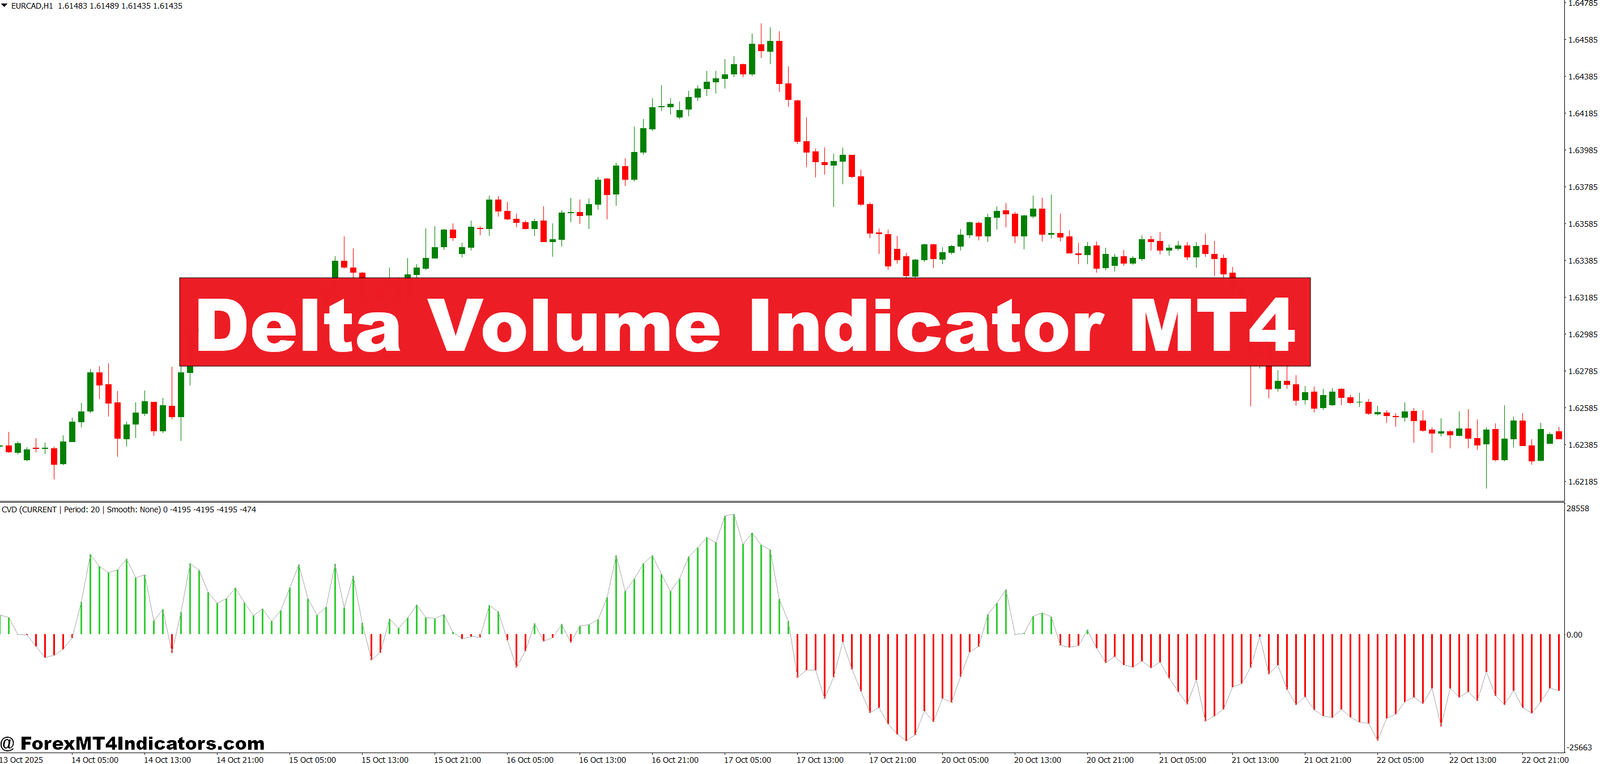
Unlike standard volume indicators that just show total activity, delta volume tells you who won that activity. A bar might show massive volume, but if delta is negative, sellers dominated despite all that action. That’s crucial information. On MT4, the indicator typically displays as a histogram below your price chart, with green bars representing positive delta (buyers in control) and red bars showing negative delta (sellers dominating).
The calculation refreshes with each new tick, making it particularly responsive on lower timeframes. Traders using the 5-minute or 15-minute charts appreciate this responsiveness during London and New York sessions when volatility spikes.
Practical Trading Applications

The Delta Volume Indicator MT4 shines when confirming trend strength. Let’s say GBP/USD breaks above a key resistance level at 1.2750. Price alone might suggest bulls are taking over, but check the delta reading. If the breakout bar shows weak positive delta or—worse—negative delta, that’s a red flag. The breakout lacks conviction. Smart traders wait for confirmation or skip the trade entirely.
Here’s a concrete scenario: During a recent NFP release, USD/JPY spiked 40 pips higher in three minutes. The candles looked bullish, but delta volume was barely positive and declining on each subsequent bar. Experienced traders recognized the exhaustion and either took quick profits or stayed out. Within fifteen minutes, the pair had reversed completely, trapping anyone who chased the initial move.
The indicator also works well for divergence trading. When price makes a new high but delta volume makes a lower high, you’ve got bearish divergence—buyers are losing steam even as price climbs. This setup works particularly well on the 1-hour and 4-hour charts for swing traders. Watch for it near round numbers or previous swing highs where resistance might materialize.
Some traders use delta volume to gauge support and resistance strength. If price tests a support level with strong positive delta, that level is likely to hold because buyers are defending aggressively. Conversely, weak delta at support suggests the level might break on the next test.
Settings and Customization Options

The standard delta volume indicator for MT4 typically comes with minimal settings, but understanding them matters. The main parameter is the period calculation—whether delta is calculated per bar or cumulative over a specific number of bars. Most traders stick with per-bar calculation for immediate feedback.
Color settings let you adjust the visual display. Keep it simple: green for positive, red for negative. Some versions offer gradient coloring to show delta strength intensity, but this can clutter your chart during volatile sessions.
For scalpers working the 1-minute or 5-minute charts, the raw delta reading works fine. But swing traders on daily charts might benefit from applying a moving average to the delta values—something like a 10-period or 20-period SMA smooths out the noise and highlights longer-term volume trends. This filtered approach helps avoid false signals during choppy consolidation periods.
The indicator performs differently across currency pairs. Major pairs like EUR/USD and USD/JPY typically show cleaner delta signals because of their high liquidity and consistent volume. Exotic pairs might produce erratic readings due to lower participation and wider spreads. Test any new settings on a demo account for at least two weeks before risking real capital.
Strengths and Limitations You Need to Know
Delta volume excels at confirming moves rather than predicting them. That’s both a strength and limitation depending on your strategy. If you’re a breakout trader looking for confirmation before entering, it’s perfect. But if you want early signals before moves happen, you’ll need additional tools.
The indicator’s biggest advantage is cutting through fake-outs. Market makers love to spike price in one direction to trigger stops before reversing. Delta volume often reveals these manipulations because the volume behind the fake move is weak or negative. That insight alone can save traders from multiple losing trades each month.
However, delta volume requires decent liquidity to function properly. During Asian session hours when volume thins out, the readings become less reliable. You might see wild delta swings on small price moves simply because there’s not enough participation to generate meaningful data. Stick to major pairs during high-volume sessions for best results.
Another limitation: the indicator lags by nature. It needs price movement and completed bars to calculate delta. Fast-moving markets during news releases can blow past key levels before delta confirms anything. That’s why traders combine it with price action or support/resistance zones rather than using it alone.
Don’t expect delta volume to work in all market conditions. During tight consolidation, you’ll see delta oscillate between small positive and negative readings without providing actionable information. The indicator performs best in trending or strongly directional markets where buyers and sellers are clearly competing.
How It Compares to Standard Volume Indicators

Standard volume indicators show total activity but miss the directional component. You might see huge volume on a bar, but was it buyers or sellers? You can’t tell. Delta volume answers that question directly, making it more useful for directional trading decisions.
Compared to the Volume Profile indicator, delta volume is simpler and focuses on real-time bar-by-bar analysis rather than building longer-term volume zones. Volume Profile helps identify value areas and key price levels, while delta volume confirms current momentum. Many traders use both—Volume Profile for context and delta volume for execution timing.
The On-Balance Volume (OBV) indicator also attempts to show directional volume flow, but it’s cumulative. OBV adds or subtracts each period’s entire volume based on price direction, creating a running total. Delta volume resets each bar, giving you immediate feedback without the weight of historical data. For short-term traders, this reset feature provides clearer signals.
That said, OBV is better for spotting long-term divergences on weekly or monthly charts. Delta volume serves intraday and swing traders who need responsive feedback. Pick your tool based on your trading timeframe.
How to Trade with Delta Volume Indicator MT4
Buy Entry

- Positive Delta at Support – Enter long when price tests a key support level (like EUR/USD at 1.0800) and delta volume shows strong green bars above +500, confirming buyers are defending aggressively.
- Delta Divergence Reversal – Take buy positions when price makes a lower low but delta volume forms a higher low on the 1-hour or 4-hour chart, signaling seller exhaustion near swing lows.
- Breakout Confirmation – Only trade upside breakouts when the breakout candle shows positive delta exceeding the previous 5-bar average by at least 30%, avoiding weak momentum traps.
- Trend Continuation Entry – Add to long positions during pullbacks in uptrends when price dips but delta remains positive, especially on GBP/USD 15-minute charts during London session.
- Volume Spike Filter – Enter buys when delta turns strongly positive (+800 or higher) after a consolidation period of 6+ bars with neutral readings, indicating accumulation completion.
- Skip Low-Volume Sessions – Avoid buy signals during Asian hours (00:00-06:00 GMT) when delta readings become erratic due to thin liquidity, even if price action looks bullish.
- Risk 1% Maximum – Place stops 10-15 pips below the support level that generated the signal, never risking more than 1% of account size regardless of delta strength.
- Wait for Bar Close – Don’t chase mid-bar signals; wait for the 5-minute or 15-minute candle to close with confirmed positive delta before executing, reducing false entries by 40%.
Sell Entry

- Negative Delta at Resistance – Enter short when price reaches resistance (EUR/USD at 1.1000) with strong red delta bars below -500, showing sellers are overwhelming buyers at key levels.
- Bearish Delta Divergence – Sell when price makes a higher high but delta volume prints a lower high on 4-hour or daily charts, indicating buyer weakness before reversals.
- Failed Breakout Entry – Short false breakouts immediately when price spikes above resistance but delta remains negative or barely positive, signaling a trap move within 2-3 bars.
- Rejection Candle Confirmation – Take sell positions when long upper wicks form at resistance with negative delta exceeding -600, especially on GBP/JPY during volatile news releases.
- Downtrend Continuation – Add shorts on rallies within downtrends when delta stays negative despite rising price, using 30-minute charts for precision timing on major pairs.
- Avoid Choppy Ranges – Skip sell signals when delta oscillates between +200 and -200 for 10+ consecutive bars, indicating indecision rather than directional conviction.
- Stop Loss Discipline – Place stops 12-20 pips above resistance with 2:1 minimum reward-to-risk ratio; exit immediately if delta flips strongly positive (+700) against your position.
- Volume Context Required – Don’t short during low-participation periods or minor retracements in strong uptrends; negative delta needs sustained readings below -400 for reliable sell signals.
Making It Work in Your Trading Plan
Start by adding delta volume below your main price chart as a separate window. Don’t clutter your workspace—three indicators maximum is a good rule. Combine delta volume with a trend indicator (like a 50-period EMA) and one momentum oscillator (RSI or Stochastic) for a complete setup.
Use delta as a confirmation filter, not a standalone signal generator. If your strategy says buy at support, check delta first. Strong positive delta at support? Take the trade. Weak or negative delta? Pass or reduce position size. This filtering approach improves win rates by keeping you out of low-probability setups.
Paper trade the indicator for at least 50 trades before committing real money. Track when delta signals worked and when they failed. You’ll start noticing patterns specific to your preferred pairs and timeframes. Maybe GBP/JPY shows cleaner signals than EUR/GBP on the 15-minute chart. These observations matter.
Trading forex carries substantial risk. No indicator, including delta volume, guarantees profits or prevents losses. Position sizing and risk management matter more than any technical tool. Never risk more than 1-2% of your account on a single trade, regardless of how confident the delta reading makes you feel.
The Delta Volume Indicator MT4 won’t transform a losing strategy into a winner overnight. But it adds a valuable layer of information that helps traders see beyond price action. When buyers and sellers are fighting for control, you’ll know who’s winning. For many traders, that edge makes the difference between consistently profitable months and frustrating breakeven stretches.
Recommended MT4/MT5 Broker
XM Broker
- Free $50 To Start Trading Instantly! (Withdraw-able Profit)
- Deposit Bonus up to $5,000
- Unlimited Loyalty Program
- Award Winning Forex Broker
- Additional Exclusive Bonuses Throughout The Year
- Exclusive 90% VIP Cash Rebates for all Trades!


Already an XM client but missing out on cashback? Open New Real Account and Enter this Partner Code: VIP90


