


The Delta Volume Indicator for MT5 tackles this exact problem. It measures the difference between buying and selling volume in real-time, showing who’s actually in control during price movements. Instead of guessing whether that breakout has legs, traders get quantifiable data about order flow strength. This article breaks down how this indicator works, when it matters most, and where it falls short.
What Delta Volume Actually Measures
Delta volume calculates the difference between uptick volume and downtick volume for each bar. When price moves up on a tick, that volume gets counted as buying pressure. When price ticks down, it’s selling pressure. The indicator subtracts selling volume from buying volume, giving traders a net number that reveals which side dominated that period.
Here’s the simple math: Delta = Buy Volume – Sell Volume.
A positive delta means buyers absorbed more volume than sellers. A negative delta shows sellers were more aggressive. The magnitude matters too—a delta of +5,000 contracts shows stronger conviction than +500.
What makes this different from standard volume? Regular volume indicators just show total activity without direction. A bar could have massive volume from buyers getting destroyed or from buyers aggressively accumulating. Delta volume removes that ambiguity. It answers the question: “Who won this bar?”
How Traders Use Delta Volume in Practice

The most common application involves confirming breakouts. When GBP/JPY breaks a key level at 188.50 on the 4-hour chart, smart traders don’t just watch the candle. They check if delta volume supports the move. A breakout bar with delta of +8,000 carries more weight than one with delta of +200. Strong positive delta on a bullish breakout suggests institutional money is pushing, not just retail stop-runs.
Divergences create another edge. Price makes a higher high, but delta volume shows declining positive values or turns negative. This warns that buying pressure is weakening even as price grinds higher. Experienced traders recognize this as distribution—smart money exiting into eager buyers. The opposite works for bottoms: price drops to new lows while delta shows less aggressive selling.
That EUR/USD scenario from earlier? If the trader had checked delta volume, he might have noticed the breakout bar showed delta of only +300 despite a 25-pip move. Weak accumulation on a supposed bullish breakout is a red flag. Three bars later when price reversed, the down bar probably showed delta of -2,500—real selling pressure.
Settings and Customizations

The standard delta volume indicator doesn’t require complex adjustments, but period settings matter. On scalping timeframes like the 1-minute chart, traders might track cumulative delta over the last 50 bars to smooth out noise. Swing traders on daily charts might extend this to 20 periods for broader context.
Some versions include a moving average overlay. A 9-period EMA of delta values helps identify trend shifts in buying or selling pressure. When delta crosses above its moving average, accumulation is accelerating. Crosses below signal distribution.
Volume profile integration makes sense for forex pairs with centralized exchange data (futures contracts). For spot forex where volume is broker-specific, the indicator becomes less reliable. This is why serious delta volume traders often use it on currency futures like 6E (EUR/USD) or 6B (GBP/USD) rather than spot markets.
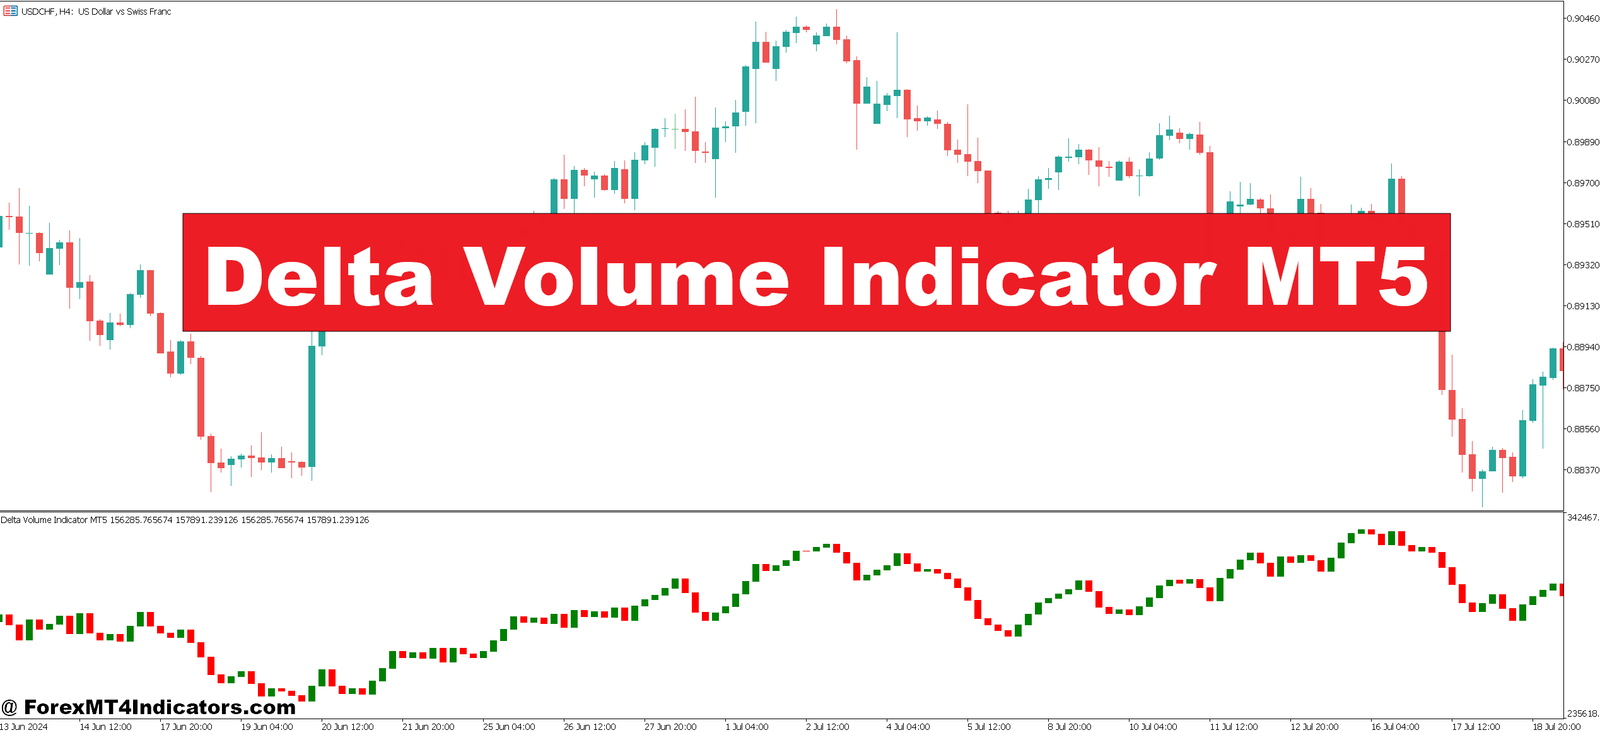
Color coding helps too. Green bars for positive delta, red for negative, with intensity showing magnitude. At a glance, traders see if the recent 10 bars show consistent buying or if there’s conflict between price direction and volume flow.
Where Delta Volume Excels and Where It Fails

The indicator shines during trending markets and at decision points. When USD/CAD is trending down and every bounce shows negative delta, it confirms sellers are in control. Traders can fade rallies with confidence. At major support or resistance, delta volume often tips off the likely outcome before price commits.
But it has clear limitations. In ranging, choppy markets, delta whipsaws constantly. One bar shows +400, the next -380, then +220. No clear pattern emerges because neither side has conviction. Traders who rely on delta during consolidation often overtrade meaningless fluctuations.
The bigger problem? Spot forex volume isn’t real volume. Most MT5 brokers show tick volume—the number of price changes, not actual contracts traded. This makes delta volume on spot pairs an approximation at best, misleading at worst. A pair could show huge positive delta simply because the feed had more upticks, even if actual volume was balanced.
Here’s what separates delta volume from tools like On-Balance Volume or Accumulation/Distribution: it’s bar-specific rather than cumulative. OBV builds a running total that can trend for months. Delta resets each bar, showing immediate pressure. This makes delta more responsive but less useful for identifying long-term institutional positioning.
Combining Delta Volume With Price Action
Smart traders don’t use delta volume in isolation. They combine it with support/resistance, candlestick patterns, and trend structure. When AUD/USD tests the 0.6400 level for the third time and delta volume shows weakening negative values, that support level gains credibility. Sellers are exhausting themselves.
Or consider a bullish engulfing pattern on the EUR/GBP 1-hour chart. The pattern alone might be tradeable, but adding delta confirmation strengthens the setup. If that engulfing candle shows delta of +1,200 compared to the previous down bar’s -300, the reversal has real teeth behind it.
Risk management still matters. Even with strong delta confirmation, trades need defined stop losses. A spike in opposite-direction delta can signal invalidation. If a long position on NZD/USD was entered on strong positive delta, but the next three bars show accelerating negative delta, that’s a warning to tighten stops or exit.
How to Trade with Delta Volume Indicator MT5
Buy Entry

- Positive delta breakout confirmation – When EUR/USD breaks above resistance with delta reading +500 or higher, enter long within 3-5 pips of breakout candle close on the 1-hour chart.
- Divergence at support – Price makes lower low but delta shows higher low (less selling pressure), signaling exhaustion; enter when next candle closes bullish with positive delta on 4-hour timeframe.
- Cumulative delta reversal – After 5+ consecutive negative delta bars on GBP/USD, first bar showing delta above +300 signals buying resumption; place stop 15-20 pips below recent swing low.
- Delta momentum alignment – Enter only when current delta exceeds previous 3-bar average by 50% or more, confirming accelerating buying pressure rather than weak bounces.
- Volume spike at key levels – When price tests major support (like 1.0800 on EUR/USD) with delta jumping from +100 to +800+, buyers are defending aggressively; enter with tight 10-pip stop.
- Avoid during choppy delta – Skip buy signals if last 10 bars show alternating positive/negative delta with no clear trend; this indicates ranging conditions where breakouts fail.
- Moving average cross confirmation – Take buy signal only when delta crosses above its 9-period EMA while price is above 50-EMA on daily chart, filtering out counter-trend noise.
- Risk 1-2% maximum – Even with strong positive delta, never risk more than 2% of account; delta volume confirms direction but doesn’t eliminate whipsaw risk in volatile sessions.
Sell Entry

- Negative delta breakdown – When GBP/JPY breaks below support with delta reading -500 or lower, enter short within 3-5 pips of breakdown candle close on 4-hour chart.
- Bearish divergence at resistance – Price makes higher high but delta shows declining positive values or turns negative; enter when next candle closes bearish with delta below -200.
- Distribution pattern recognition – After strong uptrend, when price consolidates near highs but delta shows 3+ consecutive negative readings, institutions are exiting; short the break of consolidation low.
- Delta exhaustion signal – Enter short when delta drops from +600 to -400 within 2 bars on EUR/USD 1-hour chart, indicating sudden shift from buying to aggressive selling.
- Failed breakout with negative delta – Price briefly breaks resistance but delta stays negative (-300 or worse); short when price falls back below breakout level with 12-15 pip stop above false break high.
- Avoid in strong uptrends – Don’t short solely on negative delta if price is above rising 200-EMA on daily chart; counter-trend shorts against momentum get destroyed even with volume confirmation.
- Cumulative selling pressure – When 7+ out of last 10 bars show negative delta on USD/CAD 4-hour chart, short next pullback to resistance with delta reading -250 or lower.
- News event caution – Never take sell signals 30 minutes before or after major economic releases (NFP, CPI, Fed decisions); delta becomes unreliable as volume spikes erratically regardless of real market direction.
The Realistic Verdict on Delta Volume for MT5
Delta volume adds a dimension most retail traders ignore: the actual battle between buyers and sellers. It confirms breakouts, identifies divergences, and reveals when trends are losing steam. For traders working with forex futures or centralized exchange data, it’s a legitimate edge.
The tool demands context though. It works best in trending environments and at key levels, less so during choppy consolidation. The spot forex limitation can’t be ignored—tick volume approximation means the data isn’t as pure as equity or futures markets. Traders need to verify signals with price action and not treat delta as a standalone system.
Trading forex carries substantial risk. No indicator guarantees profits, and leverage can magnify losses as quickly as gains.
The real value comes from what delta volume prevents: chasing weak breakouts and holding dying trends too long. That alone can save traders from the expensive mistakes that drain accounts. Test it on demo first, understand its quirks on your specific broker’s feed, and use it as confirmation rather than gospel. The traders who win with delta volume are the ones who respect both its insights and its limitations.
Recommended MT4/MT5 Broker
XM Broker
- Free $50 To Start Trading Instantly! (Withdraw-able Profit)
- Deposit Bonus up to $5,000
- Unlimited Loyalty Program
- Award Winning Forex Broker
- Additional Exclusive Bonuses Throughout The Year
- Exclusive 90% VIP Cash Rebates for all Trades!


Already an XM client but missing out on cashback? Open New Real Account and Enter this Partner Code: VIP90


