


")


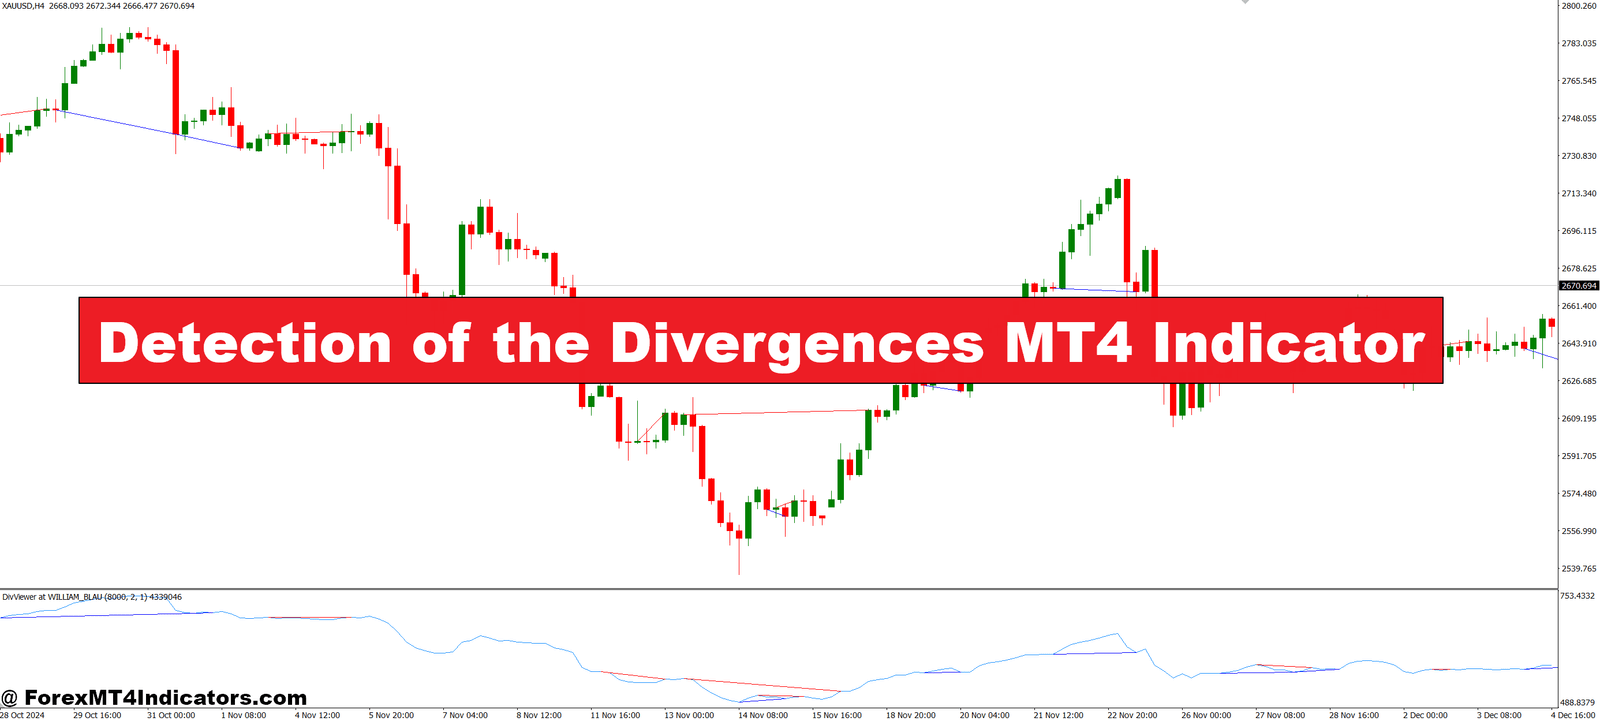

The Detection of the Divergences MT4 Indicator is a technical tool designed to spot divergence patterns between price action and momentum indicators like RSI or MACD. Divergences occur when the price moves in the opposite direction of the indicator, often signaling a potential reversal or weakening trend. This MT4 indicator automatically scans the charts and highlights divergence zones, helping traders save time and reduce the chances of human error. It works in real-time and suits both day traders and swing traders.
Why Divergences Matter in Trading
Divergences are a valuable part of market analysis because they offer early warnings about price direction. For example, when prices are rising but the RSI shows lower highs, this bearish divergence could mean a trend reversal is near. Many traders ignore these signs or fail to spot them until it’s too late. The Detection of the Divergences Indicator simplifies this task by marking these zones clearly on the chart, helping traders make smarter, more confident decisions based on real data, not guesswork.
How the Indicator Helps Traders

This indicator isn’t just for experts. Beginners benefit, too. It removes the need to manually study each candle or trendline and shows visually where the divergence occurs. Traders can adjust settings based on their trading style—whether they prefer short-term scalping or long-term setups. It supports multiple timeframes and can be used alongside other indicators to confirm entries or exits. Plus, it works with popular momentum tools, so integration into an existing strategy is easy.
How to Trade with Detection of the Divergences MT4 Indicator
Buy Entry

- Look for a bullish divergence where the price forms lower lows, but the indicator (like RSI or MACD) forms higher lows.
- Wait for the indicator to draw a bullish divergence line on the chart.
- Confirm with a bullish candlestick pattern (e.g., hammer, bullish engulfing).
- Enter a buy trade at the close of the confirmation candle.
- Place a stop-loss just below the recent swing low.
- Target the next resistance level or use a risk-reward ratio of at least 1:2.
Sell Entry

- Look for a bearish divergence where the price forms higher highs, but the indicator forms lower highs.
- Wait for the indicator to draw a bearish divergence line on the chart.
- Confirm with a bearish candlestick pattern (e.g., shooting star, bearish engulfing).
- Enter a sell trade at the close of the confirmation candle.
- Place a stop-loss just above the recent swing high.
- Target the next support level or maintain a risk-reward ratio of 1:2 or better.
Conclusion
The Detection of the Divergences MT4 Indicator makes it easier for traders to identify hidden market signals that often lead to major trend changes. By simplifying the process of finding divergences, this tool saves time, reduces mistakes, and boosts trading confidence. Whether you’re a new or experienced trader, using this indicator can improve your decision-making and help you stay one step ahead in the market.
Recommended MT4/MT5 Broker
XM Broker
- Free $50 To Start Trading Instantly! (Withdraw-able Profit)
- Deposit Bonus up to $5,000
- Unlimited Loyalty Program
- Award Winning Forex Broker
- Additional Exclusive Bonuses Throughout The Year
- Exclusive 90% VIP Cash Rebates for all Trades!


Already an XM client but missing out on cashback? Open New Real Account and Enter this Partner Code: VIP90


")
