


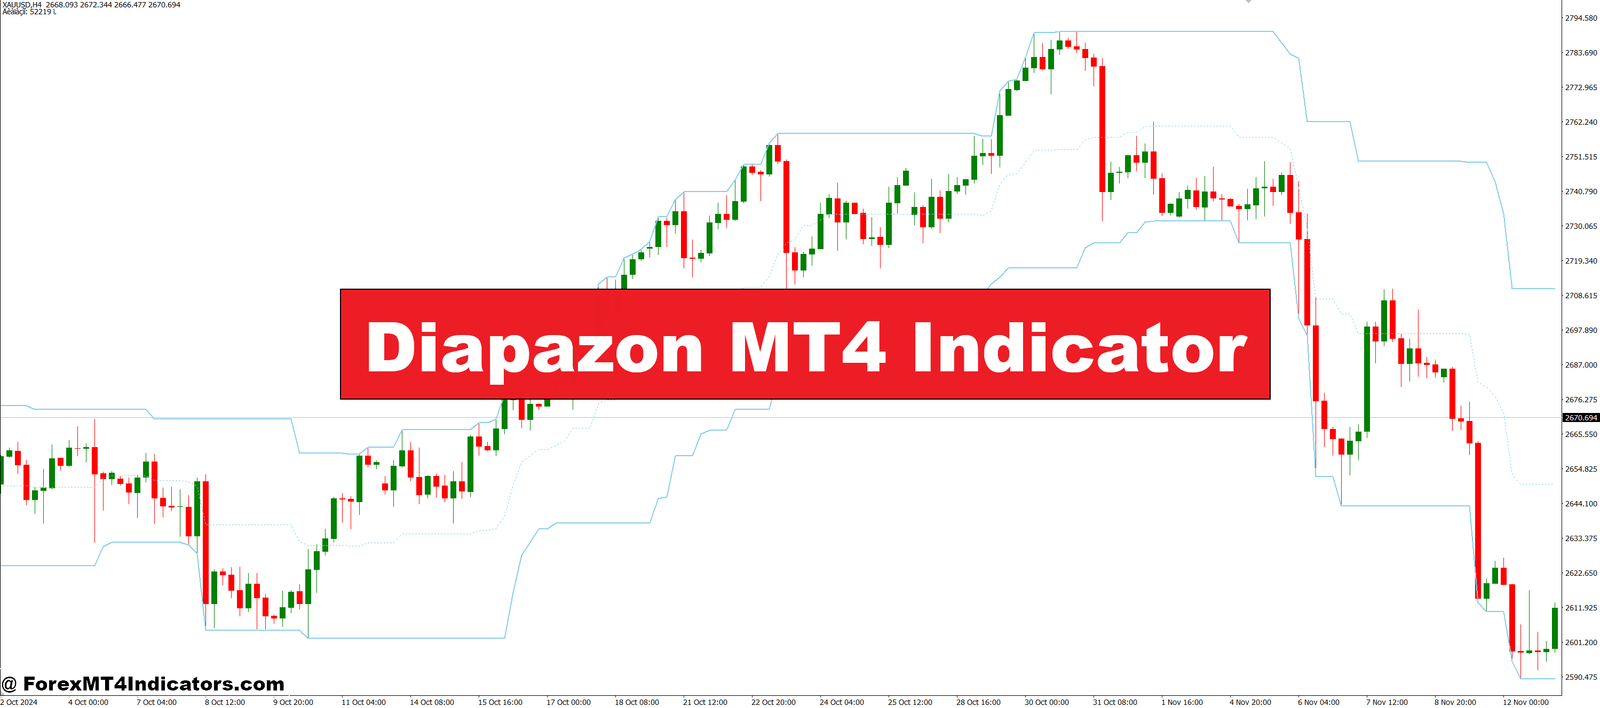
The Diapazon MT4 Indicator helps traders visualize price zones where the market tends to bounce or stall. It draws upper and lower range lines based on recent price behavior, making it easy to identify where the price is likely to move next. These lines act like invisible walls, showing traders the boundaries where price might reverse or break out. It’s especially useful during sideways markets, where trends are hard to find but range trading can be profitable.
How It Helps in Real Market Conditions
This indicator is great for spotting consolidation phases. When price keeps bouncing between the upper and lower lines, traders can consider shorting near the top and buying near the bottom. But once price breaks out of this range with momentum, it often signals the start of a new trend. The Diapazon tool simplifies this by giving a clear visual cue that even beginner traders can follow. It works on most timeframes, making it flexible for day traders and swing traders alike.
Combining with Other Tools for Better Accuracy
While the Diapazon MT4 Indicator is powerful on its own, it performs even better when used with other tools like RSI, MACD, or moving averages. These additional indicators can confirm the strength of a breakout or the likelihood of a reversal at the range boundaries. For example, if price touches the upper band and RSI is overbought, it might be a good time to consider a short trade. This layered approach increases confidence and reduces the chances of false signals.
Why Traders Like It

Traders appreciate the simplicity and clarity of the Diapazon MT4 Indicator. It removes the guesswork from range trading and gives users a framework to work within. Since it updates in real-time, it helps keep up with changing market conditions without lag. Whether someone is new to trading or has experience, this tool adds value to any technical analysis setup.
How to Trade with Diapazon MT4 Indicator
Buy Entry

- Wait for the price to reach or touch the lower Diapazon range line.
- Confirm the price is showing signs of support (e.g., bullish candlestick pattern like a hammer or engulfing).
- Optionally, use RSI or MACD to check for oversold conditions.
- Enter a buy trade when the price starts to bounce upward from the lower boundary.
- Set stop-loss just below the recent swing low or below the Diapazon bottom line.
- Take profit near the upper Diapazon range line or previous resistance level.
Sell Entry

- Wait for the price to reach or touch the upper Diapazon range line.
- Look for signs of resistance or reversal (e.g., bearish candlestick patterns).
- Optionally, confirm with indicators like RSI showing overbought levels.
- Enter a sell trade when the price begins to move downward from the upper boundary.
- Set stop-loss just above the recent swing high or above the Diapazon top line.
- Take profit near the lower Diapazon range line or previous support area.
Conclusion
The Diapazon MT4 Indicator is a smart choice for traders who want to master range trading and improve their entry timing. By marking clear price boundaries, it takes the uncertainty out of market analysis. Easy to use and effective on different timeframes, this indicator can become a valuable part of any trader’s toolbox. Give it a try and see how it changes your trading experience.
Recommended MT4/MT5 Broker
XM Broker
- Free $50 To Start Trading Instantly! (Withdraw-able Profit)
- Deposit Bonus up to $5,000
- Unlimited Loyalty Program
- Award Winning Forex Broker
- Additional Exclusive Bonuses Throughout The Year
- Exclusive 50% Cash Rebates for all Trades!


Already an XM client but missing out on cashback? Open New Real Account and Enter this Partner Code: 𝟕𝐖𝟑𝐉𝐐


