





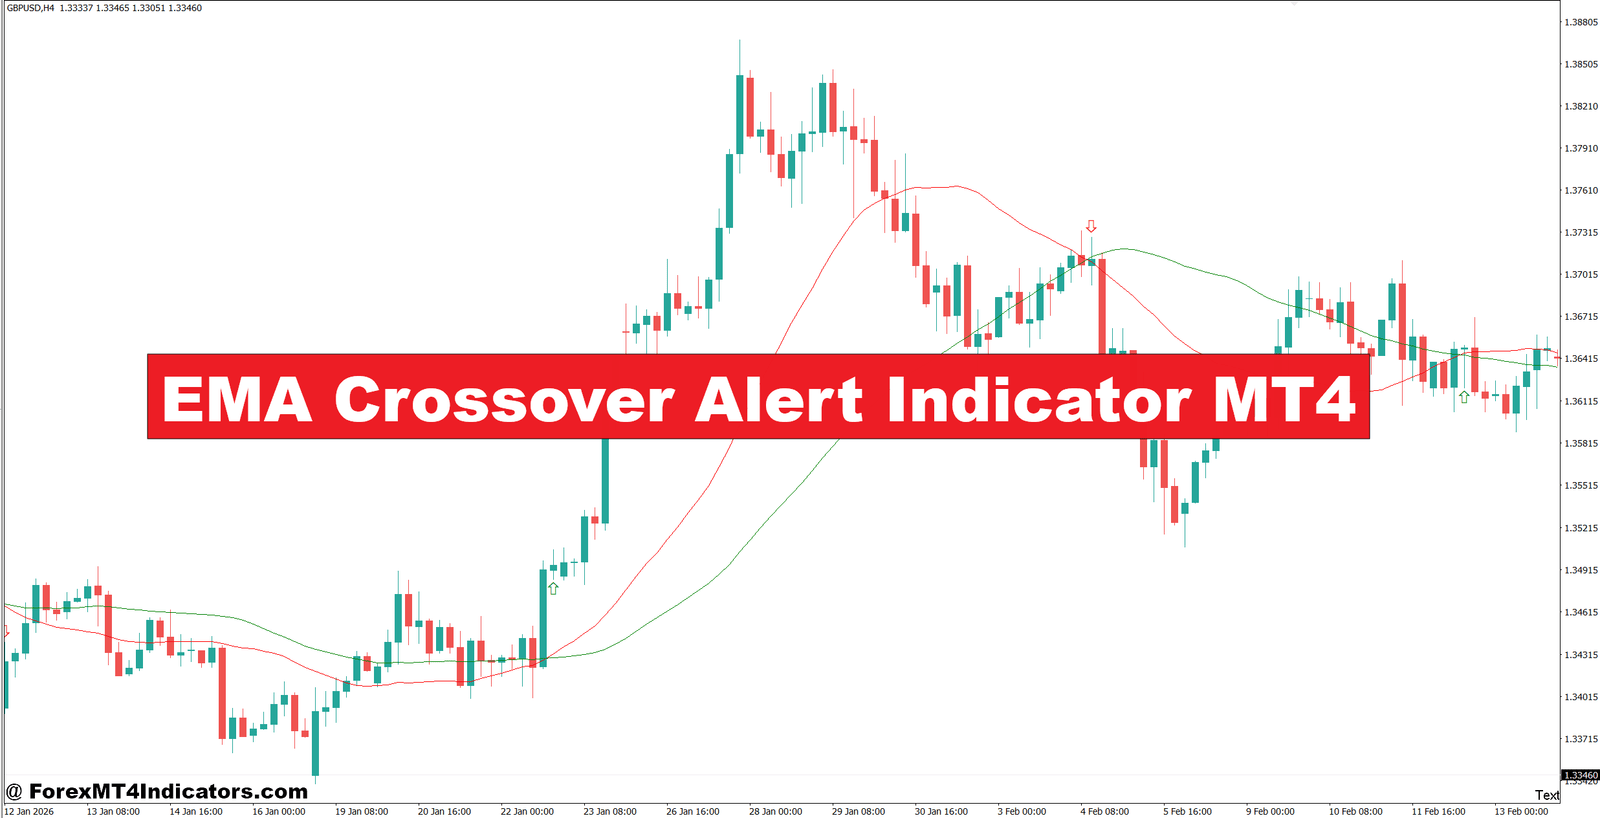
The EMA Crossover Alert Indicator MT4 is a MetaTrader 4 technical analysis tool that monitors the relationship between two exponential moving averages. When the faster EMA moves above or below the slower EMA, the indicator can generate a visual or sound alert, depending on its settings.
The calculation behind it is straightforward. An EMA gives greater weight to recent prices than an SMA. Its basic calculation uses the previous EMA value and the latest closing price:
EMA = (Current Price × Multiplier) + (Previous EMA × (1 − Multiplier))
The multiplier is calculated from the selected period:
Multiplier = 2 ÷ (Period + 1)
For example, a common setup uses a 9-period EMA and a 21-period EMA. When the 9 EMA crosses above the 21 EMA, bullish momentum may be developing. A cross below the 21 EMA can suggest weakening momentum or a possible bearish move.
The key word is possible. The crossover itself doesn’t predict how far price will travel.
How Traders Can Read EMA Crossover Signals
A crossover becomes more useful when it agrees with the broader market structure. For example, suppose EUR/USD is trading on the 1-hour chart and has formed higher highs and higher lows. The 9 EMA then crosses above the 21 EMA near a previous support zone around 1.1050. If the crossover candle closes strongly and price remains above both EMAs, the setup has more supporting evidence than an isolated crossover in the middle of a range.
A trader might enter around 1.1060 after confirmation, place a stop 15 to 20 pips below the recent swing low, and target 30 to 45 pips. That produces a potential reward-to-risk ratio near 2:1 when the stop is around 20 pips and the target is 40 pips.
The same logic works in reverse. Imagine GBP/USD on the 4-hour chart has been making lower highs. The faster EMA crosses below the slower EMA near resistance. A bearish rejection candle appears, and the next candle closes below the recent swing low. That combination is more meaningful than simply selling because an alert appeared.
Timeframe Matters
EMA settings should match the trading style. A 5/13 EMA combination can react quickly on M5 or M15 charts, but it will also produce more noise. A 9/21 setup is often easier to manage on M15 and H1. Traders looking at H4 charts may prefer something slower, such as 20/50, to reduce unnecessary crossover signals.
Gold can behave differently from EUR/USD. XAU/USD often moves 20 to 50 pips quickly during active sessions, so a fixed 10-pip stop can be too tight for many setups. Traders should measure recent volatility instead of applying the same stop to every market.
Practical Setup: From Alert to Trade
Here’s the thing: the alert should not be treated as an automatic entry command.
Consider EUR/USD on the 1-hour chart. Price has been holding above a clearly defined support area at 1.1020. The 9 EMA crosses above the 21 EMA at 1.1040, while the crossover candle closes near its high. The next candle breaks 1.1050 and continues higher.
A trader could consider an entry near 1.1050–1.1055, with a stop around 1.1025 if the structure supports that distance. A 50-pip target would then offer roughly a 2:1 reward-to-risk ratio if the risk is about 25 pips.
But what happens if the crossover occurs inside a 30-pip range? The setup becomes much weaker. If EUR/USD repeatedly moves between 1.1000 and 1.1030 and the EMAs keep crossing every few candles, the indicator is describing market chop rather than a clean trend.
Support and resistance can also improve signal selection. A bullish crossover near established support deserves more attention than one directly underneath major resistance. The same principle applies to bearish signals near resistance.
News is another factor. During NFP releases, central-bank decisions, or major inflation reports, spreads can widen and price can move sharply in both directions. When testing crossover strategies on volatile NFP days, traders may see several alerts within minutes. Those signals need a different level of caution.
Settings and Customization
Most EMA crossover tools allow traders to adjust the fast and slow EMA periods, alert behavior, and sometimes the type of notification.
A practical starting point could look like this:
- M5–M15: 5/13 or 9/21 for short-term momentum setups.
- M30–H1: 9/21 or 12/26 for moderate trend confirmation.
- H4: 20/50 for slower signals and fewer market fluctuations.
- Daily: 20/50 or 50/100 when the goal is to identify larger trend changes.
These are starting points, not universal settings. A 9/21 crossover on EUR/USD won’t behave exactly like the same setup on GBP/JPY.
Traders should also test the indicator on the specific pair they trade. A setup that performs reasonably during London and New York sessions may behave poorly during quieter Asian hours. Spread, liquidity, volatility, and average candle size all influence the quality of crossover signals.
Advantages, Limitations, and Similar Indicators

The biggest advantage is simplicity. Traders can quickly see when short-term momentum changes without manually calculating moving averages. Alerts can also reduce the chance of missing a crossover while monitoring several MT4 charts.
The limitation is equally clear: an EMA crossover is a lagging signal. The moving averages need price data before they can cross, so the indicator often reacts after the initial move has started. In a sideways market, repeated crosses can produce a string of false signals.
Compared with an SMA crossover, an EMA crossover reacts faster because recent prices receive more weight. That can help traders catch momentum earlier, but the faster reaction also means more sensitivity to market noise.
The indicator can also be compared with tools such as MACD, which is built from EMA relationships and adds a signal line and histogram. RSI approaches the market differently by measuring momentum rather than moving-average direction. Bollinger Bands focus on price volatility and relative position around a moving average.
For that reason, some traders combine an EMA crossover with the 14-period RSI, support/resistance, or a simple price-action confirmation. The goal isn’t to stack ten indicators on one chart. It’s to avoid taking every crossover blindly.
Trading forex carries substantial risk. No indicator guarantees profits. Traders should test settings on historical data and a demo account before risking real money. Position size should be based on account risk, not on how convincing an alert appears.
How to Trade with EMA Crossover Alert Indicator MT4
Buy Entry

- Wait for a bullish crossover – Buy when the fast EMA crosses above the slow EMA and the candle closes above both EMAs.
- Confirm on H1 – On EUR/USD H1, look for a bullish crossover followed by a 10–15 pip move above the crossover level.
- Check higher-timeframe trend – Prefer BUY signals when the 4-hour chart shows higher highs and higher lows.
- Use support confirmation – Enter near a proven support zone, ideally after price rejects the level by 5–10 pips.
- Set a 15–25 pip stop – Place the stop below the recent swing low rather than using a fixed distance blindly.
- Target at least 1:2 R:R – If risking 20 pips, aim for approximately 40 pips or more when market structure allows.
- Avoid weak crossovers – Don’t buy when GBP/USD is moving sideways and the EMAs cross repeatedly within a 20–30 pip range.
- Protect the position – After price reaches around 20–25 pips profit, consider moving the stop toward breakeven if momentum remains strong.
Sell Entry

- Wait for a bearish crossover – Sell when the fast EMA crosses below the slow EMA and the candle closes below both averages.
- Confirm on H1 or H4 – On GBP/USD H1, prefer a SELL after a bearish crossover followed by a 10–15 pip downside break.
- Follow the larger trend – Take stronger SELL setups when the daily or 4-hour chart shows lower highs and lower lows.
- Use resistance confirmation – Look for a bearish rejection from resistance before entering, especially after a 5–10 pip rejection.
- Risk 15–25 pips – Place the stop above the latest swing high and keep the position size within the planned risk limit.
- Aim for 1:2 R:R – With a 20-pip stop, look for a 40-pip target or the next major support level.
- Skip sideways markets – Avoid SELL alerts when EUR/USD remains trapped inside a narrow 20–30 pip range with frequent EMA crosses.
- Reduce risk before major news – Avoid fresh entries shortly before NFP, CPI, or central-bank announcements because sudden 30–50 pip moves can trigger stops quickly.
Final Thoughts on EMA Crossover Trading
The EMA Crossover Alert Indicator MT4 can make trend changes easier to monitor, especially for traders who follow several currency pairs at once. Its real value comes from combining the alert with market structure and sensible trade management.
- Use the crossover as a signal, not a guarantee — confirmation from price action can filter weak setups.
- Match settings to the timeframe — faster EMAs suit short-term charts but can create more whipsaws.
- Respect volatility and key levels — support, resistance, spreads, and major news can change the quality of a setup.
- Control the downside first — a 20-pip stop and 40-pip target can be useful only when market structure supports those distances.
A trader who understands these limits can use the EMA Crossover Alert Indicator MT4 as part of a structured trading plan rather than relying on alerts alone. The better question isn’t how many signals the indicator produces, but how many of those signals fit the market conditions.
Level up your trading
Learn to read the chart — not just the indicator
eBook · Instant PDF
The Candlestick Playbook
Read and trade 40+ candlestick patterns — with exact entries, stops and exits.
Video Course · 12 modules
The Price Action Masterclass
Read clean charts the no-indicator way — pin bars, support & resistance, entries and exits.
Recommended MT4/MT5 Brokers
XM
- ✓ *FREE *$50 to start (withdrawable)
- ✓ Deposit bonus up to $5,000
- ✓ Negative balance protection
Trading forex and CFDs carries a significant risk of loss and is not suitable for everyone. Broker links are affiliate links — we may earn a commission at no cost to you.
Free MT4 Indicator Download


