


EURUSD holds the 100 hour MA
The EURUSD
EUR/USD
The EUR/USD is the currency pair encompassing the European Union’s single currency, the euro (symbol €, code EUR), and the dollar of the United States (symbol $, code USD). The pair’s rate indicates how many euros are needed in order to purchase one dollar. For example, when the EUR/USD is trading at 1.2, it means 1 euro is equivalent to 1.2 dollars. Why the EUR/USD is the Most Popular Trading PairCompared to all tradable currencies, the euro (EUR) is the world’s second most traded currency, be
The EUR/USD is the currency pair encompassing the European Union’s single currency, the euro (symbol €, code EUR), and the dollar of the United States (symbol $, code USD). The pair’s rate indicates how many euros are needed in order to purchase one dollar. For example, when the EUR/USD is trading at 1.2, it means 1 euro is equivalent to 1.2 dollars. Why the EUR/USD is the Most Popular Trading PairCompared to all tradable currencies, the euro (EUR) is the world’s second most traded currency, be
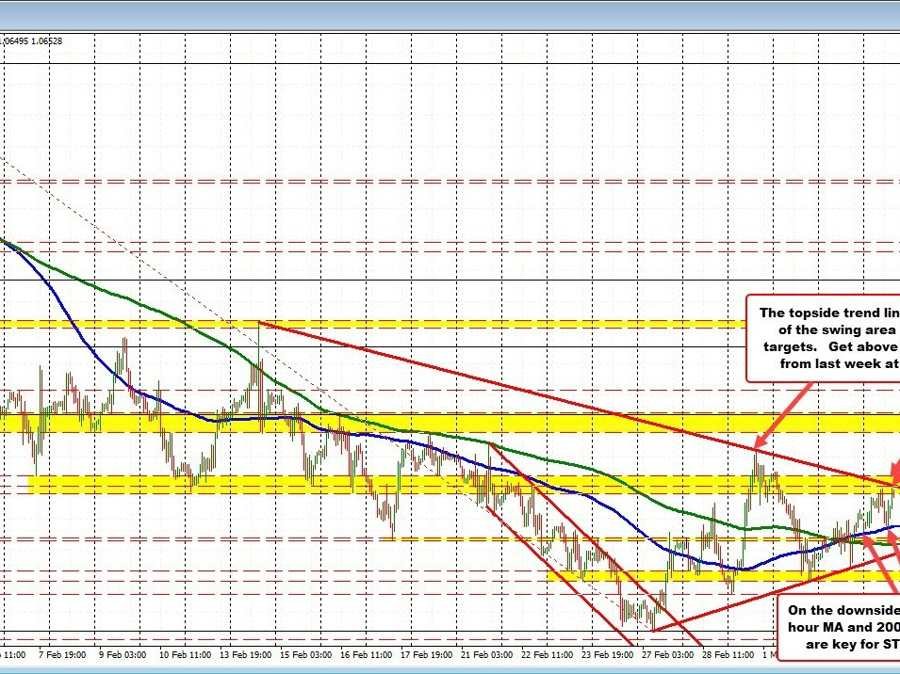
Read this Term fell at the open today, and that took the price between the 100 and 200 hour MAs (blue and green lines). The 200 hour MA could not be broken, and that invited the buyers to take control and push the price higher.
In the London morning session the price rotated back to the downside, but found support buyers against its rising 100 hour moving average
Moving average
A moving average is a statistical tool that is used to smooth out short-term fluctuations in data and reveal longer-term trends. It is calculated by taking the average of a certain number of data points over a specific period of time, and then plotting that average as a line on a chart. The most common types of moving averages are simple moving averages (SMA) and exponential moving averages (EMA).In financial markets, moving averages are often used to analyze stock prices, exchange rates, and ot
A moving average is a statistical tool that is used to smooth out short-term fluctuations in data and reveal longer-term trends. It is calculated by taking the average of a certain number of data points over a specific period of time, and then plotting that average as a line on a chart. The most common types of moving averages are simple moving averages (SMA) and exponential moving averages (EMA).In financial markets, moving averages are often used to analyze stock prices, exchange rates, and ot
Read this Term at 1.06235 currently.
The price in the early US trading has reached a new intraday high at 1.06557. There is a downslope in trendline connecting swing highs from February 14 and last Wednesday just above that level at 1.0660.
Get above that 1.0660 level, and a swing high level near 1.06685, and the door opens a bit more for the buyers.
On the topside, the high price from last Wednesday reached 1.06908. That would be the next target to get to and through. Above that and the start of another swing area comes in at 1.0707. The 38.2% retracement of the move down from the February high comes in at 1.07229.
All those levels would be in play on further upside momentum (USD selling).
If resistance can hold against the topside trendline now, the 100 hour moving average, followed by the 200 hour moving average at 1.0608 are back in play. Move below those levels and an upward sloping trendline comes in near the natural support level of 1.0600.


