







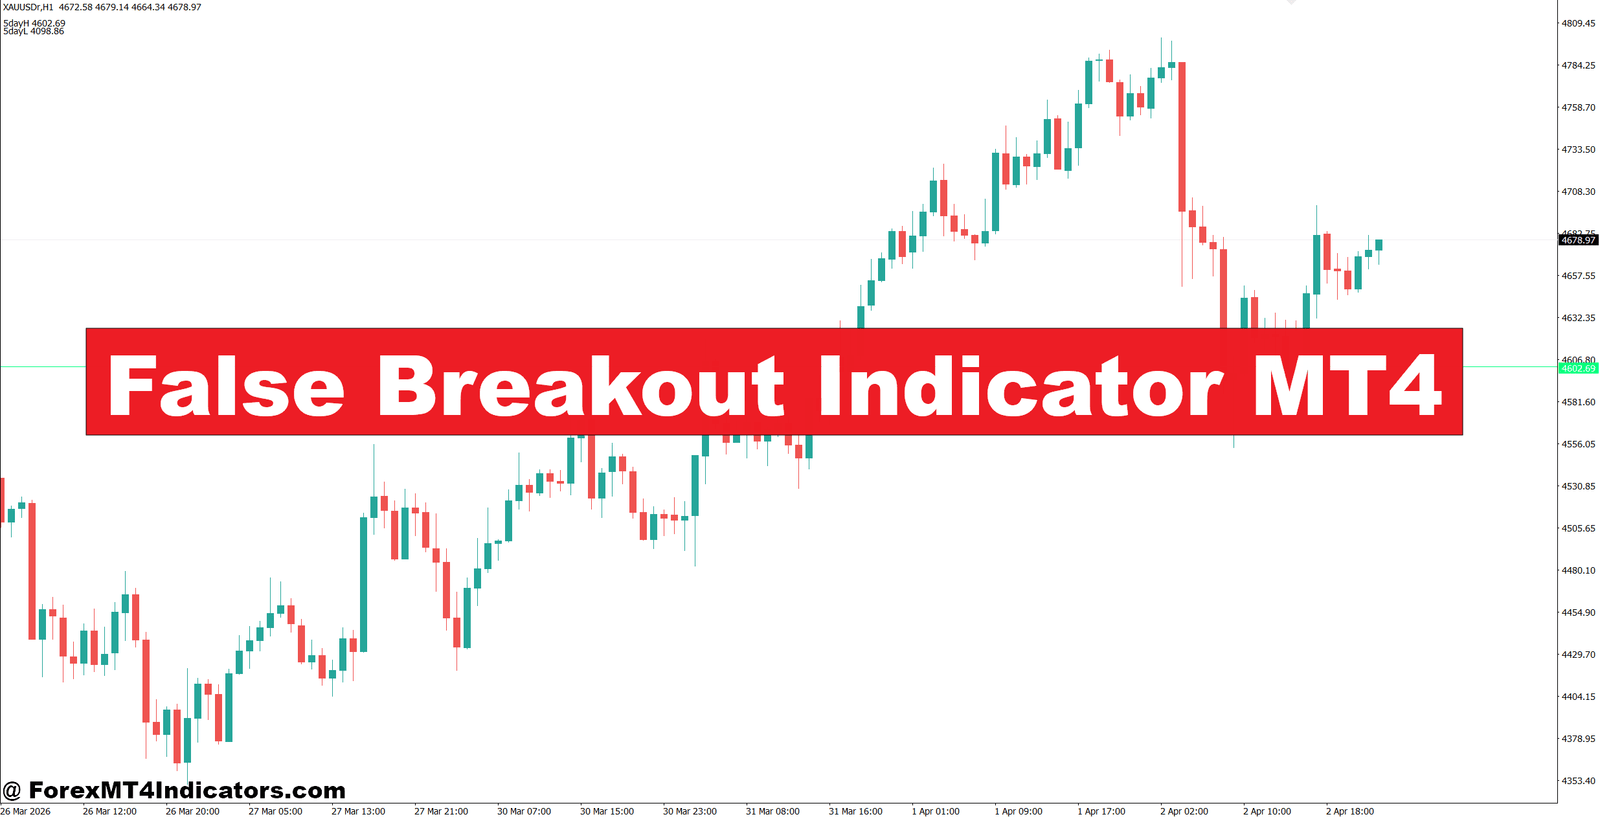
The trade ends in a loss. Situations like this happen every week, and they show why the False Breakout Indicator MT4 has become popular among price action traders.
False breakouts can lead to poor entries, unnecessary stop-loss hits, and emotional decisions after a series of losing trades. Chasing every breakout often results in giving back profits earned during trending markets. The frustration grows when the market appears to move in the expected direction before reversing sharply.
The False Breakout Indicator MT4 helps traders identify these fake-outs before they become expensive mistakes. Instead of following every breakout, the indicator focuses on price levels where reversals are more likely to happen. When combined with market structure and risk management, it can improve trade selection and reduce unnecessary entries.
The sections below explain how the indicator works, where it performs best, and how traders can include it in a practical trading plan.
What Is the False Breakout Indicator MT4?
The False Breakout Indicator MT4 is a technical analysis tool designed to detect situations where price briefly moves beyond support or resistance before returning inside the trading range. These fake moves are commonly called false breakouts, bull traps, or bear traps.
The indicator scans recent swing highs and swing lows. When price breaks those levels but fails to hold above or below them, the indicator highlights the event with arrows, symbols, or colored markers depending on the version installed.
Many traders use it alongside horizontal support and resistance, trendlines, supply and demand zones, or daily highs and lows. It works on every timeframe, although the quality of signals often improves on the 30-minute, 1-hour, and 4-hour charts because market noise is lower.
One thing experienced traders notice is that false breakouts often happen around major trading sessions. London and New York opens frequently create quick fake moves before price establishes its real direction.
How the Indicator Detects Fake Breakouts

The indicator does not predict future prices. Instead, it reacts to price behavior after a breakout attempt.
Its logic usually includes several conditions:
- Price closes beyond a recent swing high or swing low.
- The following candle quickly returns inside the previous range.
- Momentum weakens instead of continuing the breakout.
- Some versions also check candle size or volatility before generating a signal.
For example, imagine GBP/USD trading below resistance at 1.2850. A bullish candle breaks above the level and reaches 1.2868, but the next candle closes back below 1.2850. The indicator marks this as a possible bearish false breakout because buyers failed to maintain control.
When testing this setup during volatile NFP days, many traders notice that waiting for the candle to close before entering reduces unnecessary trades. Entering too early often leads to getting caught in the initial spike.
The indicator becomes even stronger when the fake breakout appears near a previous daily high, weekly resistance, or Fibonacci retracement level.
Using the False Breakout Indicator MT4 in Real Trading
The indicator performs best when traders avoid taking every signal blindly.
Suppose EUR/USD forms resistance near 1.1200 on the 1-hour timeframe. Price rallies above the level by about 12 pips before quickly closing back underneath. The indicator prints a bearish signal.
Instead of selling immediately, many traders wait for confirmation. A bearish engulfing candle or rejection wick often provides additional confidence. A stop-loss may be placed 10 to 20 pips above the false breakout high, while the first target could be the previous swing low with a minimum 1:2 risk-to-reward ratio.
Another example appears on USD/JPY during a downtrend. Price briefly drops below support by 15 pips, attracting breakout sellers. Within two candles, price moves back above support and the indicator shows a bullish reversal signal. If the higher timeframe trend also turns positive, buyers may look for an entry toward the next resistance level.
What makes this approach effective? The indicator takes advantage of situations where trapped traders are forced to close losing positions. Their exits often help accelerate the reversal.
Still, traders should avoid using the indicator during extremely low-volume periods, such as late Friday sessions, because fake signals become more common in thin market conditions.
Trading forex carries substantial risk. No indicator guarantees profits. Every position should include a predefined stop-loss and appropriate position sizing.
Optimizing Settings for Different Trading Styles
Most False Breakout Indicator MT4 versions allow traders to adjust sensitivity, lookback periods, and alert settings.
Scalpers trading the 5-minute or 15-minute charts often reduce the swing lookback period to identify more opportunities. This increases signal frequency but also creates more market noise.
Swing traders usually prefer the 4-hour or Daily charts with a longer lookback period. Fewer signals appear, but they often develop around stronger support and resistance zones.
Currency pair selection also matters.
- EUR/USD generally produces cleaner false breakout patterns because of its high liquidity.
- GBP/JPY offers larger price swings, but stop-loss distances often need to increase due to higher volatility.
- XAU/USD (Gold) creates strong fake-outs during major news releases, so waiting for candle confirmation becomes even more important.
Price alerts can save time. Instead of watching charts all day, traders receive notifications when the indicator identifies a potential setup.
Strengths, Weaknesses, and Comparison with Similar Indicators
The False Breakout Indicator MT4 stands out because it focuses on failed breakouts instead of trend direction alone.
Its biggest advantages include:
- Helps filter emotional breakout trades.
- Works well with price action strategies.
- Can improve entry timing around support and resistance.
- Supports multiple trading styles and timeframes.
It also has limitations.
During strong trends, genuine breakouts may continue without looking back. In those cases, the indicator can produce reversal signals that fail quickly. That’s why trend confirmation from tools like the 50 EMA, ADX, or higher timeframe structure often improves results.
Compared with a standard Breakout Indicator, this tool waits for evidence that the breakout has failed. Compared with a simple ZigZag Indicator, it provides more trading-focused signals around market traps rather than just identifying swing points.
Experienced traders rarely rely on one indicator alone. They combine false breakout signals with volume, candlestick patterns, and overall market structure before making a trading decision.
The indicator should be viewed as one piece of a broader trading plan rather than a complete system.
How to Trade with False Breakout Indicator MT4
Buy Entry

- Buy after a false downside breakout – Enter when price closes back above support on the 1-hour EUR/USD chart after a 10-20 pip fake break.
- Wait for candle confirmation – Use a bullish engulfing or strong bullish candle before opening the trade.
- Place stop-loss below the low – Keep the stop 10-15 pips below the false breakout candle to control risk.
- Target at least 1:2 risk-reward – Risk 20 pips to aim for 40 pips or the next resistance level.
- Trade with the higher trend – Take buy signals only when the 4-hour trend remains bullish.
- Use support confluence – Stronger setups appear near daily support or a 50 EMA on GBP/USD.
- Avoid major news events – Skip buy entries during NFP or high-impact news because fake moves become unpredictable.
- Risk only 1-2% per trade – Keep position size small even when the setup looks strong.
Sell Entry

- Sell after a false upside breakout – Enter when price falls back below resistance after a 10-20 pip fake breakout on EUR/USD 1-hour.
- Confirm with a bearish candle – Wait for a bearish engulfing or rejection candle before selling.
- Set stop-loss above the high – Place the stop 10-15 pips above the false breakout high.
- Aim for a 1:2 reward ratio – Target at least 40 pips when risking 20 pips.
- Follow the higher timeframe trend – Take sell trades only if the 4-hour or daily trend is bearish.
- Use resistance confirmation – Sell signals near weekly resistance or previous swing highs are more reliable on GBP/USD.
- Avoid ranging markets – Ignore signals when price moves inside a tight 20-30 pip range without direction.
- Limit risk to 1-2% – Protect trading capital by risking only a small percentage on each trade.
The False Breakout Indicator MT4 offers a practical way to recognize failed breakouts that often trap impatient traders. It helps identify fake moves around key support and resistance levels, works best when combined with price action confirmation, and adapts to different trading styles through customizable settings. At the same time, traders should remember that strong trends can invalidate reversal signals, making risk management essential. Instead of treating every alert as an automatic trade, they should use the indicator to build higher-quality setups with clear stop-loss placement and realistic profit targets. Consistent execution and disciplined risk control remain far more valuable than any single trading indicator.
Recommended MT4/MT5 Broker
XM Broker
- *FREE $50 To Start Trading Instantly! (Withdraw-able Profit)
- Deposit Bonus up to $5,000
- Unlimited Loyalty Program
- Award Winning Forex Broker
- Additional Exclusive Bonuses Throughout The Year


>> Sign Up for XM Broker Account here <<
(Free MT4 Indicators Download)




