






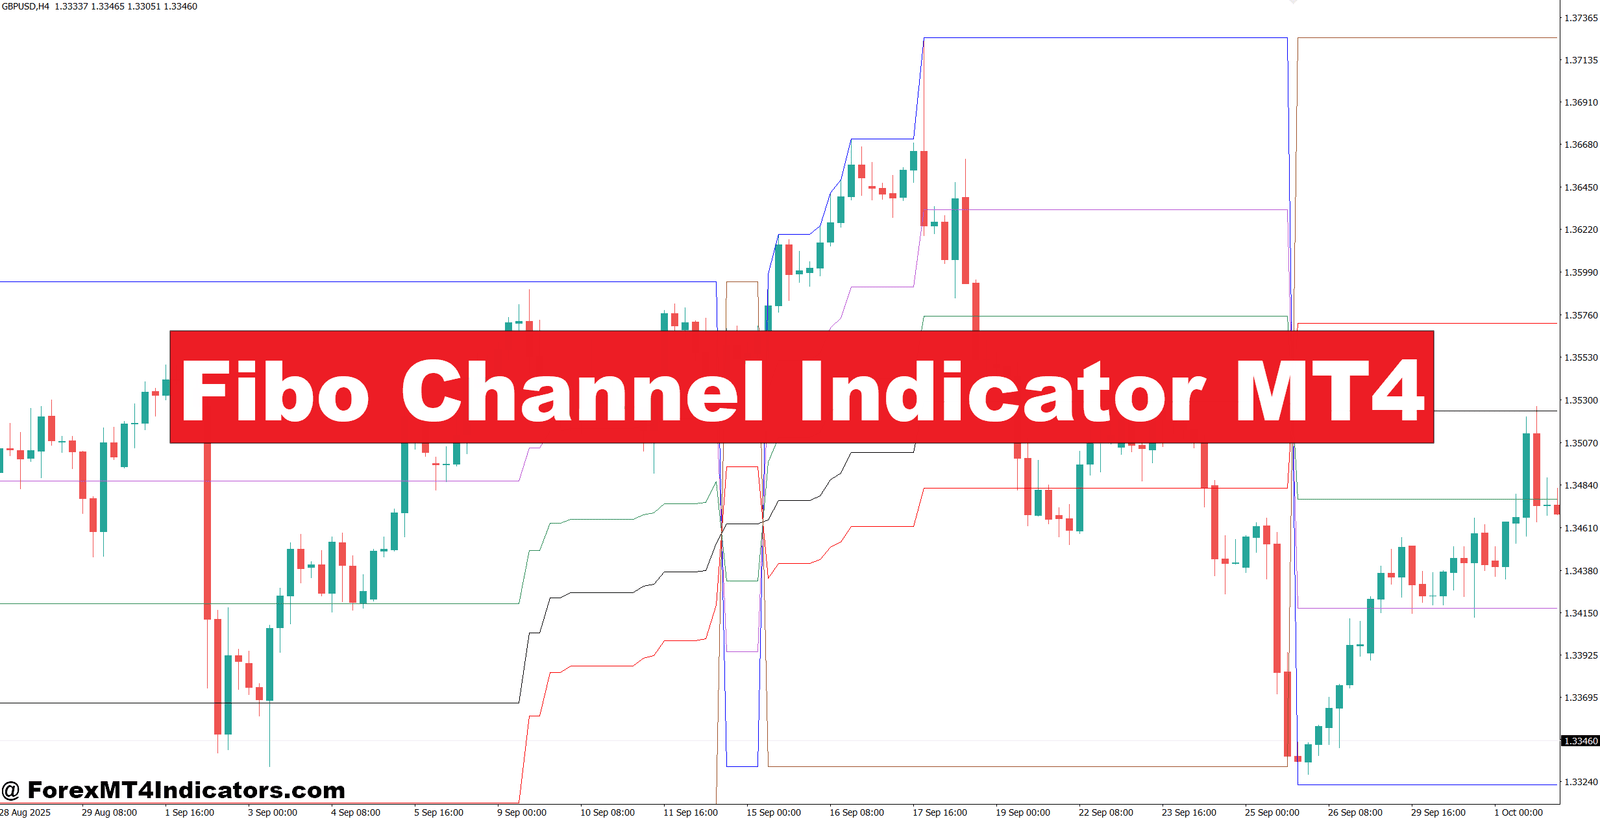
The Fibo Channel Indicator MT4 helps traders view market trends from a different angle. Instead of relying only on horizontal support and resistance, it creates dynamic Fibonacci-based channel levels that move with price. These levels can highlight areas where pullbacks may end or where price may struggle to continue.
One trader testing EUR/USD on the 4-hour chart noticed that several pullbacks respected the 61.8% channel line before the uptrend resumed. It wasn’t perfect every time, but it offered a structured way to plan entries instead of chasing candles. The sections below explain how the indicator works, where it performs best, and how traders can use it with proper risk management.
What Is the Fibo Channel Indicator MT4?
The Fibo Channel Indicator MT4 is a technical analysis tool that combines Fibonacci ratios with a trend channel. Instead of drawing standard Fibonacci retracements horizontally, it projects Fibonacci levels along an angled price channel based on the current market direction.
The indicator usually starts with two or three swing points selected by the trader. Once those points are defined, MT4 plots several parallel channel lines using common Fibonacci ratios such as 38.2%, 50%, 61.8%, 100%, and 161.8%.
Unlike fixed support and resistance, these channel levels adjust to the trend angle. This makes them useful during trending markets where price rarely respects flat levels.
Many swing traders use the indicator to identify:
- Dynamic support during an uptrend
- Dynamic resistance during a downtrend
- Potential profit targets
- Areas where pullbacks may finish
- Trend continuation opportunities
How the Indicator Calculates Channel Levels
The Fibo Channel Indicator measures the distance between selected swing points before applying Fibonacci ratios across parallel channel lines.
Here’s the basic process:
- The trader identifies two major swing highs or lows.
- A trendline establishes the market direction.
- The indicator measures the channel width.
- Fibonacci ratios are projected above and below the trendline.
If the original channel width measures 120 pips, the indicator creates additional channel lines using Fibonacci multipliers.
For example:
- 38.2% Channel = about 46 pips
- 61.8% Channel = about 74 pips
- 100% Channel = 120 pips
- 161.8% Channel = about 194 pips
These projected levels often become reaction zones rather than exact turning points.
Here’s the thing: experienced traders rarely treat these lines as automatic buy or sell signals. They wait for price action confirmation such as bullish engulfing candles, rejection wicks, or strong momentum candles before entering a position.
Using the Fibo Channel Indicator in Real Trading

The indicator works best when combined with trend analysis instead of being used alone.
Buying During an Uptrend
Suppose EUR/USD is trading above the 200 EMA on the 1-hour chart. The market makes higher highs and higher lows.
After a strong rally, price pulls back toward the 61.8% Fibonacci channel.
Instead of buying immediately, the trader waits.
A bullish pin bar forms at the channel while RSI climbs back above 50. The next candle closes above the previous high.
This creates a higher-probability entry.
Example trade:
- Currency Pair: EUR/USD
- Timeframe: 1 Hour
- Entry: 1.1025
- Stop Loss: 30 pips below recent swing low
- First Target: Previous high (55 pips)
- Second Target: 161.8% channel extension
The trade offers nearly a 1:2 risk-to-reward ratio while following the main trend.
Selling During a Downtrend
- GBP/USD is making lower highs on the 4-hour chart.
- Price rallies into the upper Fibonacci channel near the 38.2% level.
- A bearish engulfing candle forms while the MACD histogram turns negative.
- The trader sells after the candle closes instead of anticipating the reversal.
This extra confirmation helps avoid fake-outs that often happen around major news events.
When testing this setup during volatile NFP days, price sometimes broke above the channel before reversing. Waiting for candle confirmation reduced several poor entries, even though it occasionally meant entering a few pips later.
Best Settings and Customization Tips
Most MT4 versions allow traders to customize Fibonacci ratios, colors, line styles, and channel width.
Popular settings include:
Short-Term Trading
- Timeframe: M15 or M30
- Currency pairs: EUR/USD, USD/JPY
- Confirmation: 20 EMA and RSI (14)
- Stop Loss: 15-25 pips
These settings suit active traders but can produce more false signals during sideways markets.
Swing Trading
- Timeframe: H4 or Daily
- Currency pairs: GBP/USD, AUD/USD, EUR/JPY
- Confirmation: 50 EMA or 200 EMA
- Stop Loss: 40-80 pips
Higher timeframes generally create cleaner channel structures because market noise is lower.
Some traders also remove the 50% Fibonacci level to reduce chart clutter and focus mainly on the 38.2%, 61.8%, and 100% channels.
Strengths, Weaknesses, and Similar Indicators
The Fibo Channel Indicator offers several advantages over standard trendlines.
It creates multiple support and resistance zones instead of relying on a single line. That gives traders more flexibility when planning entries, stop-loss placement, and profit targets.
Another benefit is its ability to adapt to angled trends. Traditional Fibonacci retracement tools work well after completed swings, while Fibonacci channels remain useful as trends continue developing.
Still, no indicator works under every market condition.
During ranging markets, price may cross several channel lines without creating meaningful trading opportunities. News-driven volatility can also push price through multiple Fibonacci levels before the market settles.
Trading forex carries substantial risk. No indicator guarantees profits. Every setup should include proper position sizing, stop-loss placement, and confirmation from price action or another technical indicator.
Compared with Bollinger Bands, the Fibo Channel Indicator focuses more on trend direction than volatility. Against Andrews’ Pitchfork, it offers additional Fibonacci projection levels that many traders use for target planning. Compared with standard Fibonacci Retracement, the channel version is often more effective when trends remain active instead of moving sideways.
How to Trade with Fibo Channel Indicator MT4
Buy Entry

- Trade the 61.8% Channel Bounce – Buy when EUR/USD on the 1-hour chart rejects the 61.8% Fibo Channel with a bullish candle. Place a 20-30 pip stop-loss.
- Confirm the Uptrend First – Only buy if price stays above the 200 EMA on the 4-hour chart and forms higher highs.
- Wait for Candle Confirmation – Enter after a bullish engulfing or pin bar closes at the channel support to reduce false entries.
- Target the Next Channel Level – Aim for the next Fibo Channel line or 40-80 pips, maintaining at least a 1:2 risk-to-reward ratio.
- Use RSI as a Filter – Buy only when the 14-period RSI rises above 50 after the pullback.
- Protect Your Trade – Move the stop-loss to breakeven after the trade gains 25-30 pips.
- Avoid News Volatility – Skip buy setups during high-impact events like NFP or FOMC, as price can break the channel unexpectedly.
- Trade Strong Trends Only – Ignore buy signals if the market is ranging or the Fibo Channel is nearly flat.
Sell Entry

- Sell at the Upper Channel – Sell GBP/USD on the 1-hour or 4-hour chart when price rejects the upper Fibo Channel with a bearish candle. Use a 20-35 pip stop-loss.
- Follow the Main Trend – Only sell when price remains below the 200 EMA and continues making lower highs.
- Wait for Bearish Confirmation – Enter after a bearish engulfing or shooting star closes near the channel resistance.
- Aim for Lower Channel Support – Set profit targets at the next Fibo Channel level or 40-100 pips, depending on market volatility.
- Use MACD Confirmation – Take sell trades only when the MACD crosses below the signal line.
- Reduce Risk Quickly – Shift the stop-loss to breakeven after gaining 25-30 pips to protect profits.
- Avoid Counter-Trend Trades – Don’t sell if the daily trend is strongly bullish, even if price reaches the upper channel.
- Skip Low-Volume Sessions – Avoid sell signals during quiet Asian session ranges, where fake breakouts are more common.
Final Thoughts
The Fibo Channel Indicator MT4 gives traders another way to study trending markets through dynamic Fibonacci support and resistance. Its biggest strengths include identifying pullback zones, improving target selection, and helping traders follow market structure instead of chasing price. At the same time, it performs best when paired with confirmation from candlestick patterns, moving averages, or momentum indicators. Like any technical tool, it has limits during choppy conditions and major news releases. Traders who spend time practicing on historical charts and combine the indicator with disciplined risk management often gain more confidence in their trading decisions before risking real capital.
Recommended MT4/MT5 Broker
XM Broker
- *FREE $50 To Start Trading Instantly! (Withdraw-able Profit)
- Deposit Bonus up to $5,000
- Unlimited Loyalty Program
- Award Winning Forex Broker
- Additional Exclusive Bonuses Throughout The Year


>> Sign Up for XM Broker Account here <<
(Free MT4 Indicators Download)


