


")


The Fibo Musang MT5 indicator is an automated Fibonacci retracement tool built around the CBR concept — Candle Break and Retest. It doesn’t just slap Fibonacci levels on random swings. Instead, it identifies specific candlestick structures (breaks, retests, and confirmed momentum shifts) before drawing anything on your chart.
The traditional way to trade Fibo Musang is completely manual. Traders would spot an Initial Break (IB) on the D1 or H4 chart, wait for a CB1 confirmation (that’s when price breaks the previous high or low after the IB forms), then manually plot Fibonacci retracement levels to find entries and take-profit targets. That process takes time, skill, and a lot of chart staring.
The MT5 indicator automates most of that workflow. It scans for CBR setups, plots the relevant Fibonacci levels, and marks entry zones — all without you needing to manually draw a single line. For traders already familiar with the FMCBR method, this saves 20 to 30 minutes per pair per session. For those new to the concept, it provides a visual framework to learn from.
Here’s what separates it from a generic auto-Fibonacci tool: it doesn’t just connect the most recent swing high to swing low. It specifically looks for the CBR sequence — Initial Break, then CB1 confirmation, then the retest zone — before painting levels. That distinction matters because it filters out a lot of choppy, low-probability setups that standard Fibonacci indicators would highlight.
How the Fibo Musang Logic Works

The indicator’s engine runs on a three-step confirmation process.
Step one is the Initial Break (IB). This happens when a candle or pair of candles “kills” the previous candle — meaning the current candle’s body fully engulfs or closes beyond the prior candle. An IB at the start of a new trend carries weight. An IB in the middle of a range? Less so. The indicator distinguishes between a one-to-one IB (broken by one or two candles) and a Dominant Break (broken by three or more opposing candles). The Dominant Break signals stronger conviction from buyers or sellers.
Step two is the CB1 — Candle Break 1. After an IB forms, the indicator watches for price to break the previous significant high or low. When it does, CB1 is confirmed. This is the trend-change signal.
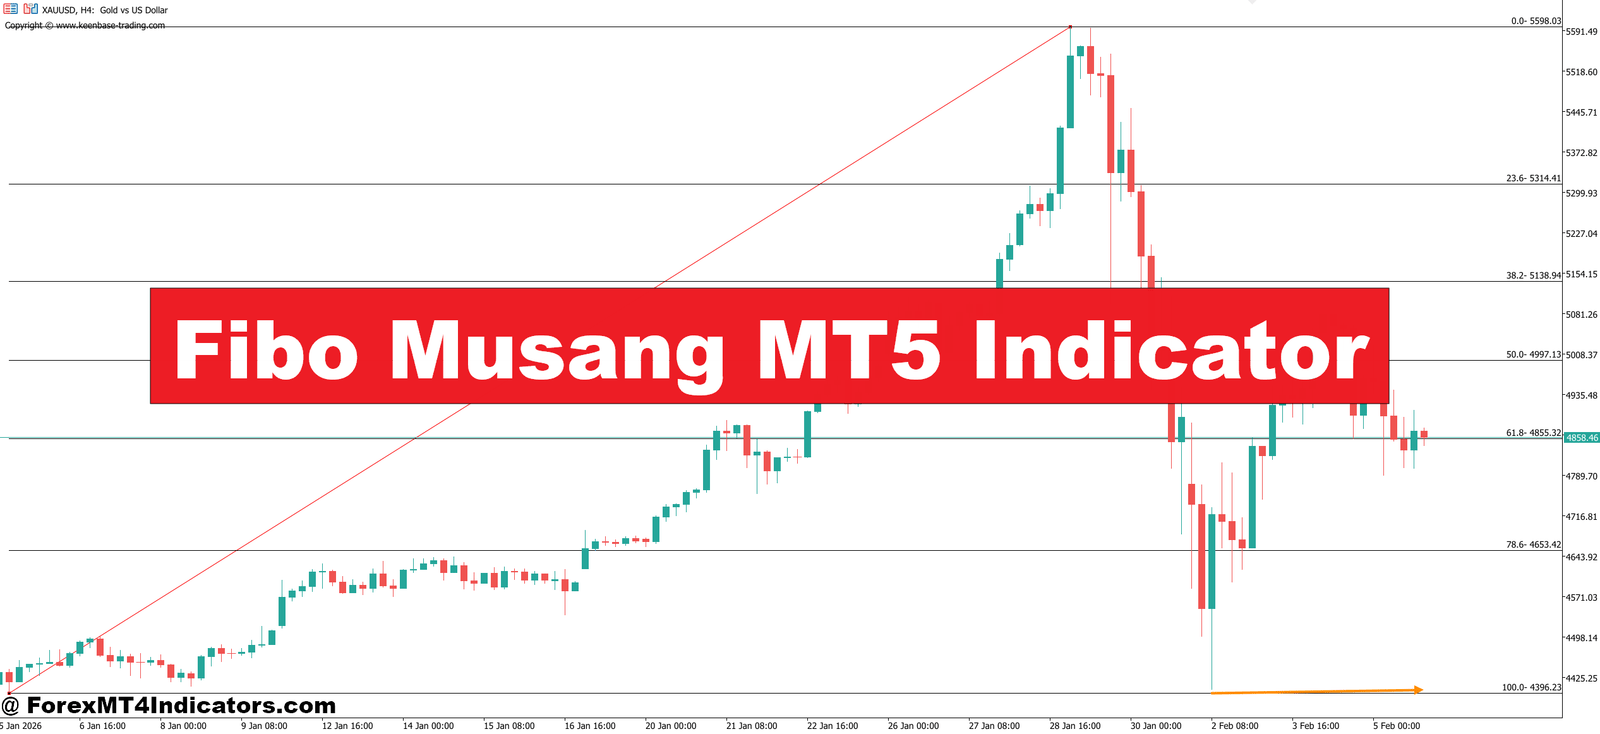
Step three is the retest. Once CB1 fires, the indicator draws Fibonacci retracement levels from the base to the breakout point. The standard Fibo Musang settings look like this:
- 0.0 — Base zone
- 0.236 — Major entry level
- 0.382 — Minor entry level
- 1.0 — Setup level
- 1.618 — Take Profit 1
- 2.618 — Take Profit 2
- 4.236 — Take Profit 3
Some versions include extended levels at 1.88, 2.88, and 4.88 for runners. The indicator plots these automatically once the CBR pattern is validated.
In practice, here’s how a trade might play out. Say GBP/USD on the H4 chart shows a Dominant Break to the upside. CB1 confirms — the previous swing high is taken out. The indicator plots Fibonacci from the base. Price retraces back to the 0.236 zone (your major entry area). You enter long, set your stop below the base, and target TP1 at the 1.618 extension. That setup gives you a clear risk-reward framework before you even click the buy button.
Fibo Musang MT5 Indicator Settings and Customization

The default settings work best on D1 and H4 timeframes — that’s what the original FMCBR system was designed around. But traders do adapt it.
On lower timeframes like M15 or M30, the indicator generates more signals, but quality drops. Whipsaws increase. If you’re using it on M15, pairing it with a higher-timeframe trend filter (like checking D1 direction first) keeps you out of the worst chop. Some traders use the H4 Fibo Musang levels for direction and then drop to M15 for precise re-entries — a multi-timeframe approach that the indicator supports well.
For pairs like EUR/USD and GBP/USD, the standard body-based marking works cleanly because price action tends to respect candlestick structures on these majors. On JPY crosses — especially GBP/JPY — the wider candle ranges mean you might want to give your entry zones a few extra pips of buffer. Gold (XAU/USD) traders have reported solid results with the CB1 breakout scanner version on MT5, though the volatility demands tighter money management.
One practical tip: don’t stack every Fibo Musang signal blindly. The highest-probability trades come when the CBR setup aligns with existing support and resistance levels, or when multiple timeframes show confluent entry zones. A 0.236 entry that also sits on a daily support level? That’s a trade worth taking. A 0.236 entry floating in the middle of nowhere? Skip it.
Strengths and Honest Limitations
What the Fibo Musang MT5 indicator does well is structure. It gives traders a repeatable entry-exit framework. The CBR logic forces confirmation before entry, which cuts down on impulsive trades. And the predefined Fibonacci take-profit levels remove the guessing game on exits.
It also teaches good habits. Even if a trader eventually moves away from the indicator, the discipline of waiting for break-and-retest setups sticks with them. That’s a transferable skill.
But it’s not without problems. The indicator can lag in fast-moving markets. During high-impact news events — NFP, FOMC — the CBR pattern might form and resolve before the indicator finishes plotting. By then, the entry zone has already been hit and passed. Traders relying solely on the indicator during news events often miss the move or enter late.
Another limitation: the original FMCBR system has nine entry levels, from basic ABC patterns to Head and Shoulders setups. Most MT5 indicator versions only automate a few of these levels — usually the CBR key and the basic retest entries. The more advanced entries (like Entry Level 6’s ABC combination or Entry Level 9’s HnS pattern) still require manual analysis.
And like any Fibonacci-based tool, the levels aren’t magic. Price doesn’t always respect 0.236 or 0.382. When it works, it looks clean. When it doesn’t, the stop gets hit. That’s trading.
How It Compares to Standard Auto-Fibonacci Tools
Most auto-Fibo indicators on MT5 — like the popular ZigZag-based Fibonacci tools — simply connect the most recent swing points and draw retracement levels. They don’t care about what caused the swing or whether a genuine trend change occurred. That means they draw Fibonacci levels on every zigzag, including meaningless chop.
The Fibo Musang indicator’s CBR filter is its real edge. By requiring the IB-CB1-Retest sequence, it only plots Fibonacci on validated breakout structures. Fewer levels on your chart, but higher-quality ones. Compare this to a plain auto-Fibo that might throw five or six overlapping Fibonacci grids on a single chart during a ranging market. That’s more noise, not more signal.
That said, traders who prefer pure price action or Smart Money Concepts (SMC) might find the FMCBR framework somewhat rigid. The entry levels are systematic, which is great for discipline but can feel limiting for discretionary traders who like to read order flow in real time.
How to Trade with Fibo Musang MT5 Indicator
Buy Entry

- Wait for a confirmed Initial Break (IB) to the upside – Don’t jump in at the first green candle. Watch for one or two bullish candles to fully close above the previous bearish candle’s body on the H4 or D1 chart. This IB marks the first sign that buyers are stepping in.
- Confirm CB1 before plotting any Fibonacci levels – After the IB forms, price must break the previous swing high. Until CB1 triggers, there’s no valid buy setup. On EUR/USD, this confirmation alone filters out roughly 40-50% of false breakouts.
- Enter long at the 0.236 retracement zone – Once the indicator plots Fibonacci after CB1, the 0.236 level is your primary buy zone. Set a limit order 3-5 pips above this level on major pairs like GBP/USD to account for spread and slippage.
- Use the 0.382 level as your second-chance entry – If price slices through 0.236 without bouncing, the 0.382 retracement acts as a deeper discount zone. This happens often during London session volatility. Don’t average down — treat it as a separate setup with its own stop loss.
- Place your stop loss 10-15 pips below the base (0.0 level) – The base is the origin of the entire CBR move. If price closes below it on H4, the setup is dead. On GBP/JPY, widen that buffer to 20-25 pips due to larger average candle ranges.
- Target TP1 at the 1.618 Fibonacci extension – This is your safest exit. On a clean H4 setup in EUR/USD, the 1.618 extension typically lands 80-120 pips from the 0.236 entry. Take at least 50% of your position off here.
- Avoid buying when price gaps past the CB1 level on a Monday open – Gap moves skip the retest entirely, leaving no valid entry zone. Wait for the gap to fill or move to the next setup. Chasing gapped breakouts is how accounts bleed slowly.
- Skip the buy if D1 trend opposes your H4 signal – A bullish CBR on H4 means nothing when the daily chart shows a strong downtrend with lower highs. Always check one timeframe above before entering. Multi-timeframe alignment doubles your win rate on this system.
Sell Entry

- Identify a bearish Initial Break on H4 or D1 – Look for one or two bearish candles that fully engulf the previous bullish candle. A Dominant Break (three or more bearish candles killing the prior candle) carries even more weight and signals aggressive seller control.
- Wait for CB1 to confirm the downside break – Price must take out the previous swing low after the IB. On USD/JPY, this step alone prevents entries into minor pullbacks that reverse within 2-3 candles. No CB1, no trade.
- Sell at the 0.236 retracement pullback – After the bearish CB1, the indicator draws Fibo levels. Price often retraces to 0.236 before continuing lower. Place your sell limit 3-5 pips below this level. On EUR/USD 4-hour charts, this level gets tested within 6-12 candles roughly 70% of the time.
- Use the 0.382 retracement as a secondary sell zone – If momentum is weak and price drifts higher past 0.236, the 0.382 zone offers a better risk-reward entry. But if price closes above 0.382 on H4, the bearish setup is losing strength — consider sitting it out.
- Set stop loss 10-15 pips above the base level – The base marks the top of the CBR structure. A clean close above it on H4 invalidates the sell. On volatile pairs like GBP/USD during NFP week, bump your stop to 20 pips and reduce lot size to keep risk under 1-2% of your account.
- Take profit at the 1.618 extension first, then trail toward 2.618 – Secure partial profits at TP1 and move your stop to breakeven. Let the remaining position ride toward 2.618 only if the daily trend supports the move. Greed at TP2 without a trailing stop is how winners turn into losers.
- Don’t sell into a clear support zone, even with a valid CBR – If the 1.618 target sits right on a weekly support level, your reward gets capped. Check where the extensions land before entering. A sell setup with 30 pips to the next major support isn’t worth a 15-pip stop.
- Avoid selling during low-volume sessions like late Friday or holiday markets – CBR setups rely on genuine momentum. Thin liquidity creates erratic wicks that trigger stops without any real directional move. If your sell signal forms after 3 PM EST on Friday, save it for Monday’s confirmation.
The Bottom Line
The Fibo Musang MT5 indicator brings structure to breakout-retest trading. It automates the tedious part — identifying CBR patterns and plotting Fibonacci levels — while still requiring the trader to make the final call on entries. The CBR filter keeps it more selective than generic auto-Fibonacci tools, and the preset take-profit levels at 1.618, 2.618, and 4.236 extensions give clear exit targets. It works best on H4 and D1 charts with major pairs, and traders who combine it with multi-timeframe analysis and support-resistance confluence tend to get the most from it. It won’t turn a losing strategy into a winning one overnight. But for traders who already understand breakout-retest mechanics and want to speed up their analysis, it’s a practical addition to the toolkit — not a replacement for skill, but a decent time-saver that keeps setups honest.
Recommended MT4/MT5 Broker
XM Broker
- Free $50 To Start Trading Instantly! (Withdraw-able Profit)
- Deposit Bonus up to $5,000
- Unlimited Loyalty Program
- Award Winning Forex Broker
- Additional Exclusive Bonuses Throughout The Year
- Exclusive 90% VIP Cash Rebates for all Trades!


Already an XM client but missing out on cashback? Open New Real Account and Enter this Partner Code: VIP90


")