


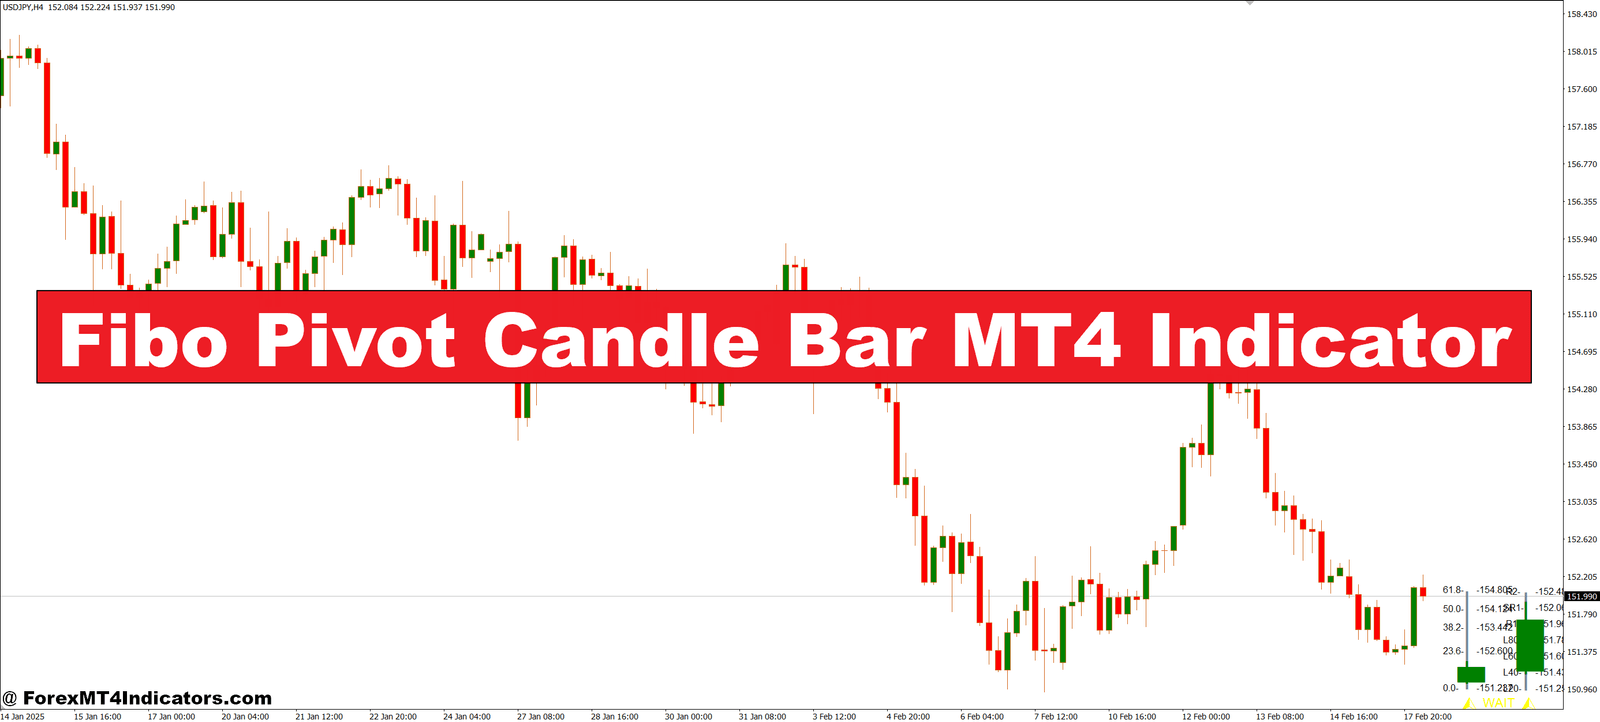

The Fibo Pivot Candle Bar MT4 Indicator is a powerful combination tool that overlays Fibonacci-based pivot levels with candle bar signals. These pivot levels act as key price zones—places where the market is likely to react. Instead of manually calculating these levels, the indicator automatically plots them on your chart and matches them with visual candle clues, giving traders a strong edge. It’s especially useful for intraday and swing traders who want to stay ahead of sudden price shifts.
Why It Matters for Traders
This indicator isn’t just for show—it offers real-time feedback that can improve trade timing. Many indicators lag, but the Fibo Pivot Candle Bar reacts quickly to current price behavior. When a price candle forms near a Fibonacci pivot zone, the indicator can signal potential reversal or continuation. This helps traders make faster, more confident decisions. Plus, the clean visual display keeps the chart readable, even in high-volatility sessions.
How to Use It Effectively

To use this tool, traders should first identify the major trend. Once the trend is confirmed, they can look for candle bar signals that appear near key pivot levels. For example, a bullish engulfing candle near a pivot support zone may suggest a bounce, while a bearish signal at a resistance pivot might warn of a drop. Combining this indicator with volume or momentum tools can add even more confirmation before entering a trade. Beginners will appreciate its simplicity, while advanced users can fine-tune its settings for precision.
How to Trade with Fibo Pivot Candle Bar MT4 Indicator
Buy Entry
- Wait for the price to approach a Fibonacci support pivot level (S1, S2, or S3).
- Look for a bullish candlestick pattern near or on the pivot level (e.g., bullish engulfing, hammer).
- Confirm that the candle closes above the pivot support zone.
- Volume or momentum indicators (like RSI or MACD) show bullish strength or oversold conditions.
- Enter a buy trade at the open of the next candle after confirmation.
Sell Entry
- Wait for the price to reach a Fibonacci resistance pivot level (R1, R2, or R3).
- Look for a bearish candlestick pattern near or on the pivot level (e.g., bearish engulfing, shooting star).
- Confirm that the candle closes below the resistance pivot zone.
- Volume or momentum indicators show bearish pressure or overbought conditions.
- Enter a sell trade at the open of the next candle after confirmation.
Conclusion
The Fibo Pivot Candle Bar MT4 Indicator makes market analysis easier by showing where price might react—before it does. It helps traders stop guessing and start trading with purpose. Whether you’re just starting out or already deep in the forex game, this indicator is worth adding to your toolkit. Simple, visual, and effective—this tool brings Fibonacci and candle reading together smartly.
Recommended MT4/MT5 Broker
XM Broker
- Free $50 To Start Trading Instantly! (Withdraw-able Profit)
- Deposit Bonus up to $5,000
- Unlimited Loyalty Program
- Award Winning Forex Broker
- Additional Exclusive Bonuses Throughout The Year
- Exclusive 90% VIP Cash Rebates for all Trades!


Already an XM client but missing out on cashback? Open New Real Account and Enter this Partner Code: VIP90


