


The Fibonacci Trend Indicator for MT4 tackles this head-on. By combining Fibonacci ratios with trend-following logic, it helps traders distinguish between noise and genuine directional shifts. Rather than relying on gut feeling, traders get visual confirmation when trend strength aligns with key Fibonacci levels. Let’s explore how this tool works and whether it deserves a spot on your charts.
What Is the Fibonacci Trend Indicator?
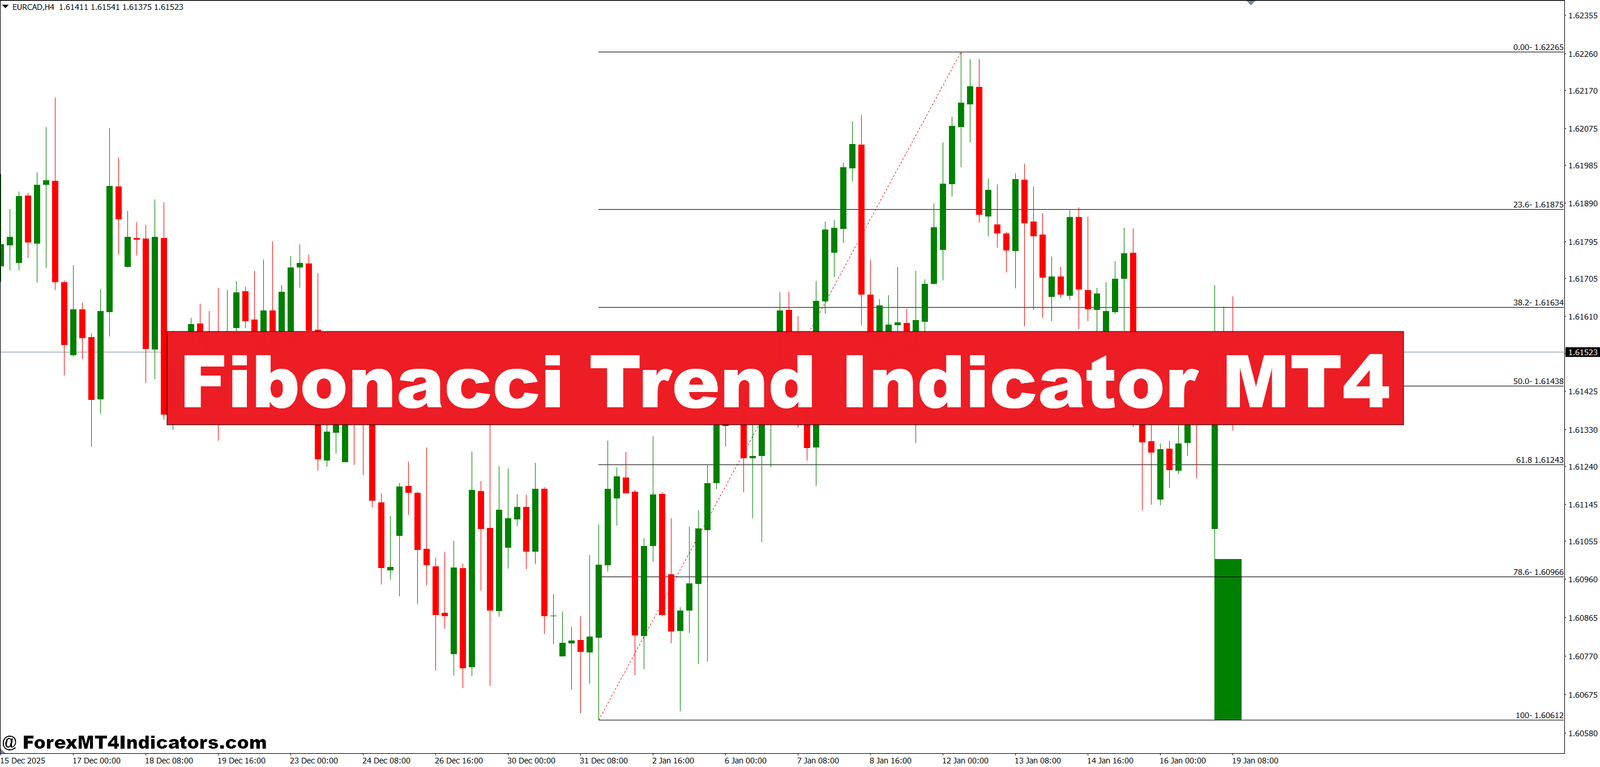
The Fibonacci Trend Indicator is a technical analysis tool designed for the MetaTrader 4 platform that merges Fibonacci retracement principles with momentum-based trend detection. Unlike static Fibonacci tools where you manually draw levels, this indicator automatically plots dynamic zones based on recent price swings.
At its core, the indicator identifies swing highs and lows within a specified lookback period. It then applies Fibonacci ratios (typically 23.6%, 38.2%, 50%, 61.8%, and 78.6%) to these swings. But here’s where it differs from standard Fibonacci retracements: the indicator adds a trend filter component. When price action confirms directional momentum—validated through moving averages or slope calculations—the indicator highlights which Fibonacci zones align with the prevailing trend.
Traders receive both visual cues (color-coded zones or arrows) and numerical data. The goal? Spot high-probability entries where Fibonacci support meets confirmed trend direction.
How the Indicator Calculates Signals

Most versions use a two-step process. First, the indicator scans a defined number of candles (often 50-100 bars) to locate the highest high and lowest low. These become anchor points for Fibonacci calculations. The indicator then plots retracement levels from these extremes.
Second comes the trend confirmation layer. Some variants incorporate a moving average crossover—a faster MA crossing above a slower one suggests uptrend strength. Others use slope calculations or RSI readings. When price retraces to a key Fibonacci level (say, the 61.8% zone) AND the trend filter confirms directional bias, the indicator generates a signal.
Here’s a concrete example: On GBP/JPY’s 1-hour chart, price rallies from 181.50 to 184.20 over 12 hours. The indicator marks 184.20 as the swing high. Price then drops to 183.10—right at the 38.2% retracement level. If the 20/50 EMA remains bullish and price shows bullish candle patterns at 183.10, the indicator flags this as a potential long entry. The logic? Shallow retracement in a confirmed uptrend often precedes continuation.
Real-World Trading Applications
The indicator shines during trending sessions—London open or New York overlap when directional moves develop. Traders watching USD/CAD might notice the indicator highlighting the 50% Fibonacci zone during a downtrend. If price bounces off this level with a bearish engulfing pattern and the trend filter stays bearish, that’s a short signal.
But timing matters. During Asian session chop on pairs like AUD/USD, the indicator produces more false signals. Why? Fibonacci works best when clear swings exist. Ranging markets lack defined swing points, causing the indicator to readjust levels constantly. Experienced traders pair this tool with session filters—only taking signals during high-volume periods.
One trader tested this approach on EUR/USD over three months. She used the 4-hour timeframe, only entering when the indicator showed confluence between the 61.8% level and an upward-sloping 50-period MA. Her win rate improved from 52% to 61%. The key wasn’t the indicator alone—it was the confluence of Fibonacci support and trend confirmation.
Risk management remains crucial. Even with indicator confirmation, stops should sit below recent swing lows (for longs) or above swing highs (for shorts). A 2:1 reward-to-risk ratio helps offset inevitable losses. Trading forex carries substantial risk. No indicator guarantees profits.
Customizing Settings for Your Strategy

Default parameters rarely suit all trading styles. The lookback period—how many candles the indicator scans for swing points—drastically affects sensitivity. A 50-bar lookback on a 15-minute chart reacts quickly but generates noise. Extending it to 100 bars smooths signals but may lag during fast moves.
For scalpers on the 5-minute chart, a 30-40 bar lookback with emphasis on the 38.2% and 50% levels works better. These shallow retracements align with quick in-and-out trades. Swing traders on daily charts might prefer 200-bar lookbacks, focusing on the 61.8% “golden ratio” where major reversals often occur.
The trend filter also needs adjustment. Some indicators let you modify the MA periods. Faster settings (10/20 EMA) suit volatile pairs like GBP/NZD. Slower settings (50/100 EMA) filter noise on major pairs during quieter sessions.
Color customization helps too. Setting bullish zones to green and bearish to red improves chart readability. Some traders disable certain Fibonacci levels entirely. If the 23.6% level produces too many false signals, turn it off.
Strengths and Honest Limitations
The indicator’s primary advantage is objectivity. Rather than manually drawing Fibonacci levels—which introduces bias about where to start and end measurements—the indicator uses algorithmic selection. This consistency helps backtest strategies and removes emotional decision-making during live trading.
It also combines two proven concepts: Fibonacci ratios (which many institutional traders watch) and trend confirmation. This dual-filter approach reduces whipsaw trades common with single-indicator systems.
That said, limitations exist. The indicator lags during sudden trend reversals. If EUR/USD drops sharply on unexpected news, the indicator may still show bullish signals for several candles while recalculating swing points. Traders can get caught on the wrong side.
Sideways markets destroy its effectiveness. During multi-day ranges, swing highs and lows constantly shift. The indicator repaints levels, creating confusion. Using it only during trending conditions—confirmed by ADX readings above 25, for instance—helps mitigate this.
Another issue: dependency on lookback period. Two traders using different settings see different signals on the same chart. There’s no “correct” setting, which means testing is mandatory. What works on USD/JPY might fail on EUR/CHF.
How It Compares to Similar Tools

Standard Fibonacci retracement tools require manual drawing. That’s both a strength and weakness—flexibility versus subjectivity. The Fibonacci Trend Indicator automates this but loses customization. Traders can’t adjust where retracements begin and end based on their analysis of market structure.
Compared to moving average crossovers, this indicator adds precision. A simple MA cross tells you trend direction but not where to enter. Fibonacci levels provide specific price zones. The combination offers more complete trade setups.
Ichimoku Cloud also identifies support levels and trend direction, but its complexity intimidates newer traders. The Fibonacci Trend Indicator presents similar information with less clutter. However, Ichimoku’s multi-timeframe perspective (through its lagging span and cloud projection) offers strategic advantages for position traders.
Bollinger Bands mark volatility zones, while this indicator marks retracement zones. Both identify potential reversal areas, but Fibonacci ratios carry psychological weight since many traders watch these levels—creating self-fulfilling prophecies.
How to Trade with Fibonacci Trend Indicator MT4
Buy Entry

- Wait for 61.8% retracement touch – Enter long when price pulls back to the 61.8% Fibonacci level during an uptrend on EUR/USD 4-hour charts, with a bullish pin bar or engulfing candle confirming support.
- Confirm with MA alignment – Only take buy signals when the 20 EMA sits above the 50 EMA, indicating sustained upward momentum, especially effective on GBP/USD during London session.
- Set stops 10-15 pips below swing low – Place your stop loss just beneath the recent swing low that created the Fibonacci calculation, typically 10-15 pips for major pairs to avoid normal volatility spikes.
- Target previous swing high first – Aim for the most recent swing high as your initial profit target, usually offering 1.5:1 to 2:1 reward-to-risk ratio on 1-hour timeframes.
- Avoid ranging markets – Skip buy signals when ADX reads below 20 or when price has been consolidating for 8+ hours, as Fibonacci levels lose reliability in sideways conditions.
- Enter on second touch – If price hits the 50% or 61.8% level and bounces, then retests it within 3-6 candles, this second touch often provides stronger entries than the first.
- Check volume confirmation – Look for increased volume (at least 1.5x average) when price bounces from Fibonacci support on USD/JPY or EUR/GBP to confirm genuine buying interest.
- Scale in at multiple levels – Split your position, entering 50% at the 50% Fib level and 50% at 61.8%, with combined stop below 78.6% retracement for better risk distribution.
Sell Entry

- Short at 61.8% resistance – Enter short when price rallies to the 61.8% Fibonacci retracement during a downtrend on GBP/USD daily charts, confirmed by bearish reversal patterns.
- Verify bearish MA structure – Only take sell signals when the 20 EMA crosses below the 50 EMA and both slope downward, preventing counter-trend trades on EUR/USD.
- Position stops 10-15 pips above swing high – Place protective stops just above the swing high used for Fibonacci calculations, adjusted to 15-20 pips for volatile pairs like GBP/JPY.
- Target 50-80 pips on 4-hour charts – Set initial profit targets at prior swing lows, typically 50-80 pips away on major pairs during trending sessions like New York open.
- Skip signals during news events – Avoid shorting within 30 minutes of high-impact news (NFP, FOMC, GDP) even if indicator shows perfect setup, as volatility invalidates technical levels.
- Watch for failed breakouts – Strong sell signals occur when price breaks above a swing high, then immediately reverses back below it and hits the 38.2% retracement within 2-3 candles.
- Confirm with RSI divergence – When price makes higher highs but RSI makes lower highs while touching 50% Fibonacci resistance, this bearish divergence strengthens sell signals on 1-hour EUR/USD.
- Trail stops at Fibonacci levels – Once price drops below the 50% level, move your stop to breakeven; at 38.2%, trail stop to the 50% level to lock profits during strong downtrends.
Key Takeaways for Traders
The Fibonacci Trend Indicator MT4 works best when traders understand its strengths and accept its limitations. It’s not a standalone solution—combine it with price action analysis, volume studies, or momentum oscillators for confirmation. Treat signals during low-volatility sessions with skepticism. Focus on trending markets where clear swing points form.
Customization matters. Default settings rarely optimize for your specific trading style or preferred pairs. Spend time backtesting different lookback periods and trend filter settings. What performs well on EUR/USD daily charts may underperform on GBP/JPY hourly charts.
The real value comes from objectivity. Automated Fibonacci levels remove guesswork about where to measure retracements. When combined with solid risk management—proper stop placement and position sizing—this indicator becomes a useful component of a broader trading system. Just remember: consistent profitability stems from discipline and strategy, not any single tool. Test thoroughly before risking real capital, and never rely on indicator signals alone to make trading decisions.
Recommended MT4/MT5 Broker
XM Broker
- Free $50 To Start Trading Instantly! (Withdraw-able Profit)
- Deposit Bonus up to $5,000
- Unlimited Loyalty Program
- Award Winning Forex Broker
- Additional Exclusive Bonuses Throughout The Year
- Exclusive 90% VIP Cash Rebates for all Trades!


Already an XM client but missing out on cashback? Open New Real Account and Enter this Partner Code: VIP90


