


The Follow Line Indicator MT4 was developed to help traders identify trend direction with more confidence. Instead of reacting to every small price movement, it focuses on filtering market noise and highlighting the dominant trend. That makes it easier to stay with strong moves while avoiding many of the short-term fluctuations that often trap traders.
Like any technical tool, it works best when combined with proper market analysis and risk management. The sections below explain how the indicator works, when traders typically use it, and what strengths and weaknesses should be considered before adding it to a trading strategy.
Understanding the Follow Line Indicator MT4
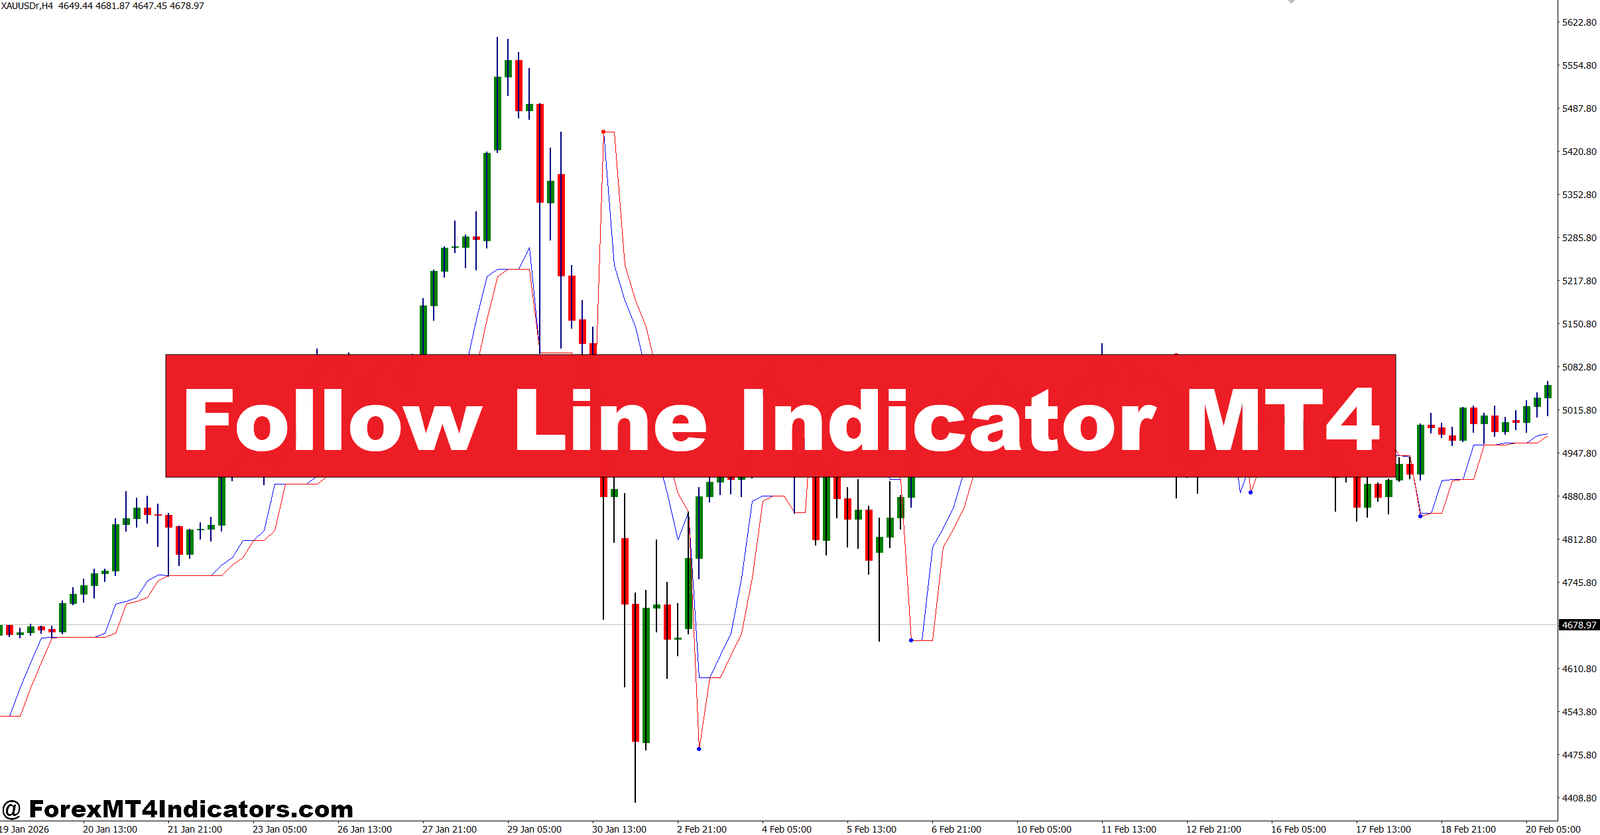
The Follow Line Indicator MT4 is a trend-following indicator designed for the MetaTrader 4 platform. It plots a colored line that changes according to market direction, giving traders a quick visual reference for bullish and bearish conditions.
Unlike simple moving averages that only smooth price data, the Follow Line Indicator attempts to react to meaningful price changes while ignoring much of the minor market noise. When price closes above the indicator line, it generally signals bullish momentum. A close below the line suggests bearish pressure may be building.
Many traders apply it to trending currency pairs such as EUR/USD, GBP/USD, and USD/JPY because these markets often produce sustained directional moves. On ranging markets, however, the indicator may produce more frequent direction changes as price moves sideways.
The indicator should never be viewed as a prediction tool. Instead, it serves as a confirmation method that helps traders evaluate the current market structure.
How the Indicator Generates Trading Signals

The Follow Line Indicator analyzes recent price action and adjusts its position as new candles develop. Although different versions may use slightly different calculations, most rely on price averages combined with trend-filtering logic to determine where the follow line should appear.
A bullish signal usually appears when:
- Price closes above the Follow Line.
- The line changes to its bullish color.
- Recent swing highs begin forming higher highs.
- Volume or momentum confirms buying pressure.
A bearish signal often develops when:
- Price closes below the Follow Line.
- The indicator switches to its bearish color.
- Lower highs and lower lows begin forming.
- Selling momentum increases.
Consider a practical example. EUR/USD on the one-hour chart breaks above a resistance level after consolidating for several hours. The Follow Line changes to its bullish color while price closes 20 pips above the previous swing high. Instead of entering immediately, an experienced trader waits for the next candle to hold above the line before opening a buy position. That extra confirmation often helps reduce false entries.
During volatile news events such as Non-Farm Payroll releases, the indicator may flip direction several times within a few minutes. When testing this on NFP Fridays, many traders notice that waiting 15 to 30 minutes after the announcement produces cleaner signals than trading the first spike.
Practical Trading Applications
The Follow Line Indicator performs best when it becomes part of a complete trading plan rather than the only reason to enter a trade.
One common approach combines the indicator with support and resistance analysis. For example, if GBP/USD bounces from a daily support zone and the Follow Line turns bullish on the four-hour chart, both technical factors point toward the same direction. That combination often provides more confidence than relying on a single indicator.
Another method uses moving averages as an additional trend filter. Some traders only accept buy signals when price remains above the 200-period Exponential Moving Average. Sell trades are considered only when price stays below that long-term average.
The indicator also works well with candlestick confirmation. A bullish engulfing pattern forming directly above the Follow Line usually carries more weight than a small indecision candle.
Risk management remains just as important as signal quality. Many traders place the stop-loss below the most recent swing low for buy trades or above the latest swing high for sell trades. A risk-to-reward ratio of at least 1:2 allows profitable trading even if only half of the trades reach their targets.
Trading forex carries substantial risk. No indicator guarantees profits.
Settings, Customization, and Performance
One advantage of the Follow Line Indicator MT4 is its flexibility across different trading styles.
Scalpers often use the indicator on the M5 or M15 charts with more responsive settings. Faster parameters produce earlier entries but may also increase the number of false signals during market chop.
Swing traders usually prefer H4 or Daily charts because longer timeframes filter much of the short-term volatility. The signals arrive less frequently, but they often align better with larger market trends.
Different currency pairs may require slight adjustments. EUR/USD generally responds well to moderate settings because of its relatively stable movement. GBP/JPY, on the other hand, is much more volatile and sometimes benefits from slightly smoother settings to reduce unnecessary signal changes.
Backtesting is worth the effort before using any new configuration on a live account. A setup that performs well during trending markets may struggle when volatility drops or when the market enters a prolonged range.
Advantages, Limitations, and Comparison
The Follow Line Indicator offers several practical benefits. Its visual signals are easy to interpret, making trend identification quicker than manually analyzing multiple moving averages. It also helps traders remain patient by encouraging them to follow the prevailing trend instead of reacting to every candle.
That said, no trend-following indicator is perfect.
The biggest limitation appears during sideways markets. Price may cross above and below the line several times, creating whipsaws that result in unnecessary losses. Experienced traders often avoid taking every signal when the market lacks a clear trend.
Compared with a traditional Moving Average, the Follow Line Indicator generally reacts faster to changing conditions while filtering some market noise. Compared with Supertrend indicators, it often provides similar trend confirmation but may produce different entry timing depending on its calculation method.
Many traders find the best results come from combining the Follow Line with RSI or MACD. If both momentum and trend point in the same direction, the overall trading setup becomes stronger than relying on one indicator alone.
Successful traders rarely depend on a single tool. Price action, market structure, support and resistance, and sound money management remain essential parts of every trading decision.
The Follow Line Indicator MT4 can become a valuable addition to a trader’s technical toolbox when used with realistic expectations. It helps identify trend direction, filters part of the market noise, and provides straightforward visual confirmation for potential entries. The strongest takeaways are simple: use it alongside price action, confirm signals with broader market structure, adjust settings to match the trading timeframe, and never ignore risk management. While the indicator won’t eliminate losing trades, it can improve decision-making when combined with a disciplined trading plan. Traders who spend time testing the Follow Line Indicator MT4 on historical data before using it in live markets usually gain a better understanding of where it performs well and where extra caution is needed.
Tips for Getting Better Results with the Follow Line Indicator MT4
Using the Follow Line Indicator by itself can produce reasonable signals, but experienced traders usually combine it with other forms of technical analysis. One useful habit is checking the higher timeframe before taking a trade. For example, if the one-hour chart generates a buy signal while the four-hour chart is also trending upward, the trade has stronger support from the broader market direction.
Patience also plays a big role. A common mistake is entering as soon as the indicator changes color. Waiting for the current candle to close often filters out temporary price spikes that disappear before the session ends. This small adjustment may reduce the total number of trades, but it can improve overall trade quality.
Market sessions should also be considered. The indicator tends to produce cleaner trends during the London and New York trading sessions because trading volume is generally higher. During the quiet Asian session, especially on pairs like EUR/USD, price may move within a narrow range and create several false signals.
Keeping a trading journal is another practical step. Traders can record the currency pair, timeframe, entry price, exit price, and the reason for taking each trade. After reviewing 50 to 100 trades, patterns often appear. Some traders discover the indicator performs best on H1 charts, while others find stronger results on H4 charts with fewer but higher-quality setups.
Finally, avoid increasing position size after a series of winning trades. Even reliable trend-following indicators experience losing streaks when market conditions change. Maintaining consistent risk—such as risking only 1% to 2% of account equity per trade—helps protect trading capital during difficult periods while allowing profitable strategies enough time to perform over the long run.
How to Trade with Follow Line Indicator MT4
Buy Entry

- Wait for a bullish color change – Enter after the candle closes above the Follow Line on the 1-hour chart.
- Trade with the trend – Buy only if the 4-hour trend is also bullish on EUR/USD.
- Confirm a breakout – Enter after price breaks resistance by at least 10–15 pips.
- Use a tight stop-loss – Place it 15–25 pips below the recent swing low.
- Look for higher highs – Buy when price forms higher highs and higher lows.
- Risk only 1–2% – Keep position size small on every trade.
- Avoid sideways markets – Skip signals if the Follow Line changes direction repeatedly.
- Target 1:2 reward – Aim for at least 40 pips if risking 20 pips.
Sell Entry

- Wait for a bearish color change – Sell after a candle closes below the Follow Line.
- Follow the higher trend – Take sells only when the 4-hour GBP/USD trend is bearish.
- Confirm support break – Enter after price closes 10–15 pips below support.
- Protect with a stop-loss – Place it 15–25 pips above the latest swing high.
- Watch lower lows – Sell when the market forms lower highs and lower lows.
- Risk only 1–2% – Never increase lot size after a winning streak.
- Skip major news – Avoid entries during high-impact events like NFP or CPI releases.
- Take profit wisely – Target at least a 1:2 risk-to-reward ratio on daily or 1-hour setups.
Recommended MT4/MT5 Broker
XM Broker
- *FREE $50 To Start Trading Instantly! (Withdraw-able Profit)
- Deposit Bonus up to $5,000
- Unlimited Loyalty Program
- Award Winning Forex Broker
- Additional Exclusive Bonuses Throughout The Year


>> Sign Up for XM Broker Account here <<


