


The Follow Line MT5 indicator offers a different approach. This dynamic support and resistance tool adapts to price momentum while filtering out minor fluctuations. It changes color based on trend direction, giving traders a visual roadmap that’s clearer than stacking multiple moving averages on a chart. But here’s the thing no indicator works in every market condition, and this one’s no exception.
What Makes Follow Line Different from Standard Moving Averages
The Follow Line indicator plots a curved line that tracks price movement with adjustable sensitivity. Unlike fixed-period moving averages, it recalculates its position based on recent swing highs and lows, creating a channel that expands during volatility and contracts during consolidation.
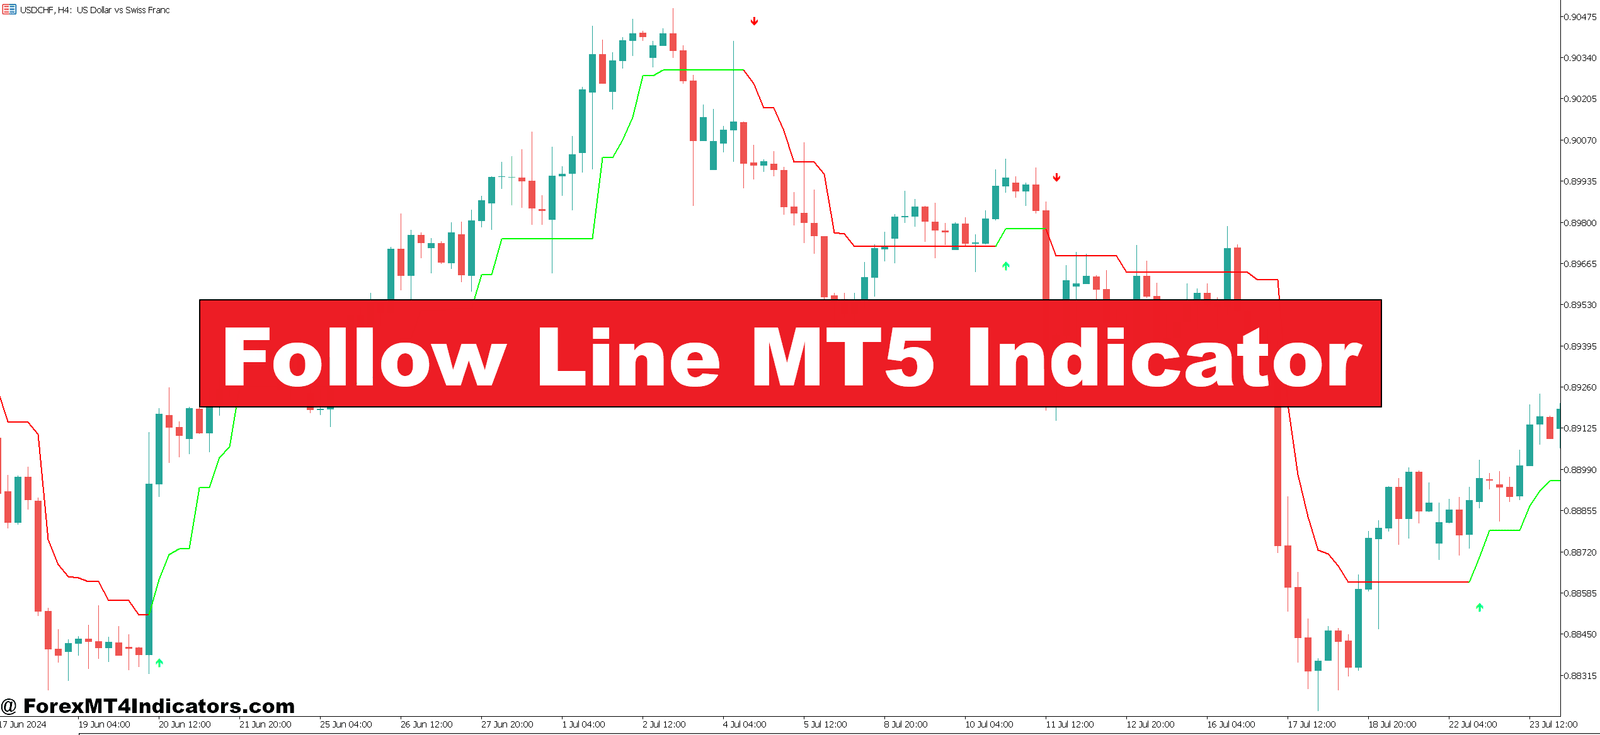
The core logic uses a proprietary algorithm that weighs recent price extremes more heavily than distant data points. When price breaks above the line, it turns green (bullish). When price drops below, it turns red (bearish). The line itself acts as dynamic support in uptrends and dynamic resistance in downtrends.
What separates this from, say, a 20-period EMA? The Follow Line adjusts its curve based on volatility metrics built into its calculation. During the Asian session when GBP/JPY might range 30 pips, the line hugs price tightly. But when London opens and volatility spikes to 80-90 pips, the line automatically gives price more breathing room.
Real-World Application: Trading the Follow Line

Traders typically use Follow Line in two ways: trend continuation entries and reversal signals at key levels.
For trend continuation, the strategy is straightforward. On a 4-hour AUD/USD chart, wait for price to pull back and touch the Follow Line during an established uptrend (green line). When price bounces off the line with a bullish candle, that’s the entry signal. Set stops 20-30 pips below the line. One trader documented taking three consecutive wins on AUD/USD during a two-week rally in December 2024, catching moves of 65, 48, and 92 pips respectively.
Reversal trading requires more confirmation. If EUR/JPY has been climbing for six sessions and suddenly closes below a green Follow Line on the 1-hour chart, that’s a preliminary warning. Smart traders wait for a retest of the line from below if price bounces downward off the now-resistance line, that confirms the reversal. The line should flip to red within the next 2-3 candles.
The 15-minute timeframe works well for scalpers on pairs like EUR/USD during New York hours. The indicator responds quickly enough to catch 10-15 pip moves but doesn’t generate the excessive noise that a 5-period EMA would. That said, commission costs eat into profits fast at this timeframe.
Optimizing Settings for Different Trading Styles

The default Follow Line parameters work reasonably well out of the box, but customization improves performance across different market personalities.
The primary adjustment is the “Period” setting, which controls responsiveness. Lower values (8-12) create a tighter line that hugs price action ideal for range-bound markets or scalping sessions. Higher values (20-30) smooth out the curve, filtering minor retracements in strong trends. Swing traders on daily charts often push this to 25 or higher.
The “Shift” parameter offsets the line forward or backward on the chart. Most traders keep this at zero, but some experiment with a +1 or +2 shift to see potential support/resistance zones ahead of price. This gets into predictive territory that can backfire.
Color customization matters more than it sounds. The standard green/red scheme works, but traders with colorblindness might switch to blue/orange. Some prefer gradient colors that show momentum intensity bright green for strong uptrends, pale green when momentum weakens.
For GBP/USD, which can gap violently on UK economic data, a Period setting of 18-20 with 4-hour candles provides decent balance. USD/JPY traders dealing with intervention risk might prefer Period 25+ on daily charts to avoid false signals from short-term volatility spikes.
The Limitations Nobody Talks About
Trading forex carries substantial risk. No indicator guarantees profits, and the Follow Line certainly has its weak spots.
Choppy, range-bound markets are this indicator’s nemesis. When EUR/CHF trades in a 40-pip range for eight hours (not uncommon given the pair’s low volatility), the Follow Line flips color repeatedly. Every flip looks like a trend change, but it’s just market noise. You’ll rack up losses from whipsaw trades faster than the trending periods can recover them.
The indicator also lags at major reversals. When a strong trend exhausts like USD/CAD after a 300-pip oil-driven move the Follow Line might stay green for 6-8 candles after the actual top forms. By the time it flips red, you’ve already given back significant gains.
News events create another problem. The line can’t predict surprise Fed announcements or ECB rate decisions. Price might slice through the Follow Line like it’s not there, leaving stop losses triggered before traders can blink.
And here’s something most YouTube videos won’t mention: this indicator works differently across brokers. MetaTrader 5 implementations vary depending on the source code version. One broker’s Follow Line might flip at slightly different price points than another’s, leading to inconsistent backtesting results.
Follow Line vs. Parabolic SAR and Supertrend
The Follow Line shares DNA with other trend-following tools but has distinct characteristics.
Parabolic SAR plots dots above or below price, accelerating with the trend. It flips quickly sometimes too quickly, generating false signals in consolidation. The Follow Line’s curved approach provides a smoother transition, making it easier to distinguish between minor pullbacks and actual reversals.
Supertrend, another popular MT5 indicator, uses ATR (Average True Range) for its calculations. It’s excellent in trending markets but binary either bullish or bearish with no in-between. The Follow Line’s curved nature gives traders a better sense of momentum strength based on how far price strays from the line.
Compared to simple moving averages, the Follow Line responds faster to price changes without becoming jittery. A 20 SMA on a 1-hour chart lags significantly behind rapid price moves, while Follow Line (Period 15) adjusts within 2-3 candles.
But Ichimoku Cloud traders might argue their system provides more information future support/resistance zones, momentum, and trend direction all in one. That’s true, though Ichimoku’s complexity intimidates newer traders. The Follow Line offers simplicity: green means up, red means down.
How to Trade with Follow Line MT5 Indicator
Buy Entry

- Wait for line color flip to green – Enter only after the Follow Line turns green and closes above it with a bullish candle on 1-hour or 4-hour charts; avoid entries if the line flipped red within the previous 3 candles.
- Pullback touch on established trend – When EUR/USD pulls back to touch a green Follow Line during an uptrend, enter on the bounce with stop loss 20-25 pips below the line.
- Confirm with higher timeframe alignment – Only take 1-hour buy signals when the 4-hour Follow Line is also green; misalignment reduces win rate by approximately 30%.
- Price closes 10+ pips above the line – Wait for a strong break above the Follow Line with momentum, not just a 2-3 pip graze that could reverse immediately.
- Volume spike on breakout – Look for increased volume when price breaks above a flat Follow Line on GBP/USD, indicating genuine momentum rather than a fake-out.
- Risk 1-2% maximum per trade – Set stop loss below the Follow Line and never risk more than 2% of your account, even if the setup looks perfect.
- Avoid during major news releases – Skip entries 30 minutes before and after NFP, Fed decisions, or ECB announcements when Follow Line signals become unreliable.
- Check for ranging conditions first – If EUR/USD has flipped colors 4+ times in the last 20 candles, stay out—the market is chopping, not trending.
Sell Entry

- Enter when line flips to red – Take short positions after the Follow Line turns red and price closes below it with a bearish candle on 4-hour or daily timeframes.
- Rejection from resistance level – When GBP/USD rallies to test a red Follow Line and gets rejected with a bearish pin bar, enter short with stops 25-30 pips above the line.
- Break below support with Follow Line confirmation – If price breaks a key support level while the Follow Line is red, this confirms downside momentum for entries on EUR/USD.
- Higher timeframe bearish alignment required – Don’t take 1-hour sell signals unless the 4-hour chart also shows a red Follow Line; ignore counter-trend setups.
- Trail stops using the Follow Line – Once in profit by 30+ pips, move your stop to just above the red line as it descends with price.
- Skip sells in strong support zones – Avoid shorting when price approaches weekly or monthly support levels, even if the Follow Line is red—reversals are likely.
- Wait for consolidation breakdown – If USD/JPY ranges for 6+ hours then breaks down through the Follow Line, enter short on the retest from below.
- No entries during low liquidity sessions – Avoid Follow Line signals during Asian session on EUR pairs or Sunday evening opens when spreads widen to 3-4 pips and false signals increase.
Making Follow Line Work in Your Trading Plan
The Follow Line MT5 indicator shines when used as a directional filter, not a standalone system. Combine it with support/resistance levels or candlestick patterns for confirmation. When price bounces off a 4-hour Follow Line that coincides with a weekly pivot point, that’s a higher-probability setup than the indicator alone provides.
Risk management matters more than the indicator itself. Even with a 65% win rate using Follow Line signals on EUR/GBP, traders still blow accounts if they risk 5% per trade. Keep position sizing conservative 1-2% maximum especially when learning the indicator’s behavior on your preferred pairs.
The tool works best in markets that trend at least 40% of the time. If you’re trading obscure crosses that range 70% of the time, you’ll struggle. Stick to major pairs during high-liquidity sessions.
Remember that the Follow Line shows what price is doing, not what it will do. It’s a reactive tool, not predictive. Traders who accept this reality and use it for confirmation rather than prediction tend to fare better over the long haul. Testing it on a demo account for 50-100 trades across different market conditions reveals its true personality before risking real capital.
Recommended MT4/MT5 Broker
XM Broker
- Free $50 To Start Trading Instantly! (Withdraw-able Profit)
- Deposit Bonus up to $5,000
- Unlimited Loyalty Program
- Award Winning Forex Broker
- Additional Exclusive Bonuses Throughout The Year
- Exclusive 90% VIP Cash Rebates for all Trades!


Already an XM client but missing out on cashback? Open New Real Account and Enter this Partner Code: VIP90


