







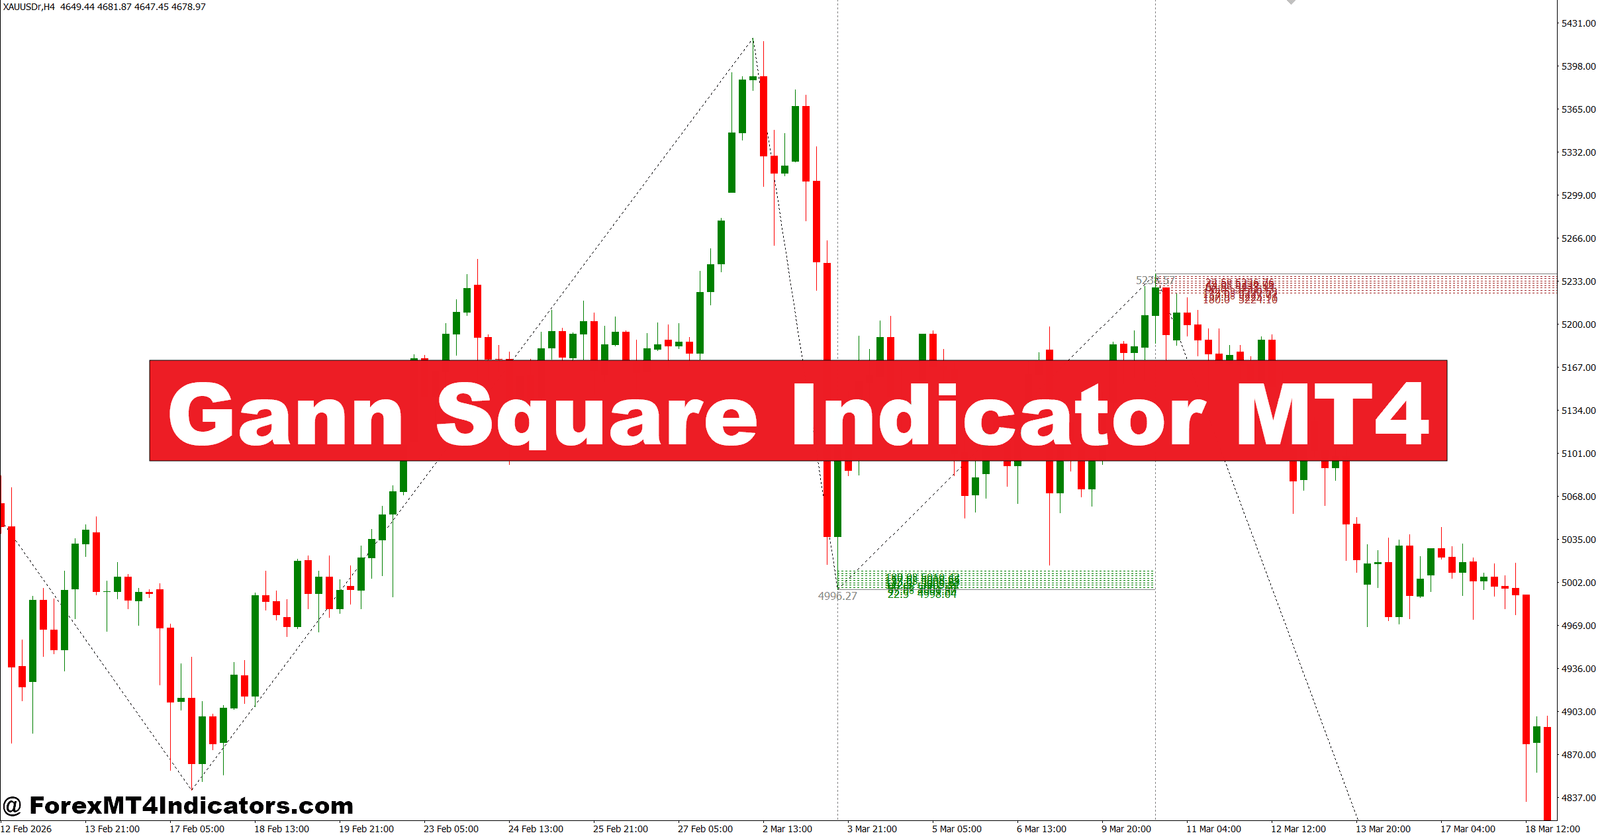
The Gann Square Indicator MT4 was designed to help traders view price from a different angle. Instead of focusing only on moving averages or oscillators, it uses geometric price relationships and projected support and resistance levels inspired by W.D. Gann’s market theories. Many traders use it to spot turning points, trend continuation zones, and potential breakout areas before price reaches them.
No indicator predicts every market move. Still, when combined with price action and solid trade management, the Gann Square Indicator MT4 can become a useful part of a structured trading plan. The sections below explain how it works, where it performs best, and how traders can use it more effectively.
Understanding the Gann Square Indicator MT4
The Gann Square Indicator MT4 is a technical analysis tool based on the market principles developed by trader W.D. Gann. His approach focused on the relationship between price, time, and market cycles rather than relying only on momentum or trend-following calculations.
The indicator automatically plots square levels, diagonal angles, or price grids depending on its version. These levels act as dynamic support and resistance areas where price may slow down, reverse, or accelerate.
Unlike indicators that react after price has already moved, the Gann Square attempts to project future price zones using mathematical relationships. That makes it popular among swing traders and position traders looking for high-probability reaction areas.
A trader watching GBP/USD on the 4-hour chart might notice price approaching a projected Gann Square level after a strong bullish trend. Instead of buying immediately, they may wait for confirmation such as a bullish engulfing candle or a rejection wick before entering.
How the Indicator Calculates Market Levels
The calculation depends on the version installed in MT4, but most Gann Square indicators use mathematical ratios between price movement and time progression.
The indicator begins with an important swing high or swing low. From that reference point, it builds geometric price levels based on equal price intervals, square relationships, or Gann angles such as 1×1, 2×1, and 1×2.
The famous 1×1 angle represents a balanced relationship between price and time. When price remains above this angle, buyers often stay in control. If price falls below it, selling pressure may become stronger.
Here’s a practical example.
EUR/USD creates a swing low at 1.0950 on the 1-hour chart after the London session opens. The indicator projects several Gann Square levels above price. As EUR/USD reaches 1.1035, sellers appear and produce two bearish rejection candles. Rather than expecting an endless rally, experienced traders may tighten stop-loss orders or look for short opportunities if additional confirmation appears.
During major events such as Non-Farm Payroll (NFP), price often ignores projected levels temporarily because volatility expands sharply. When testing this indicator on volatile NFP days, waiting 15 to 30 minutes after the news release generally reduced false entries compared with trading immediately after the announcement.
Applying the Gann Square Indicator in Real Trading

The indicator performs best when traders combine it with market structure instead of treating every projected level as a trading signal.
Trading Trend Continuation
Suppose USD/JPY is making higher highs and higher lows on the daily chart. Price pulls back toward a Gann Square support level while the 50 EMA continues pointing upward.
Instead of buying during the decline, traders often wait until a bullish candle closes above the support level. A stop-loss of around 30 to 40 pips below the recent swing low can help manage risk, while the next resistance level provides a realistic profit target.
Trading Reversals
Sometimes price reaches a major Gann Square resistance after several consecutive bullish candles.
If the RSI also shows bearish divergence and volume begins to decrease, traders may prepare for a reversal instead of chasing the trend. The indicator doesn’t create the reversal—it simply highlights an area where one becomes more likely.
Avoiding Low-Quality Trades
One useful lesson from testing this tool is avoiding trades during sideways markets.
If EUR/USD spends several hours inside a 25-pip range, projected Gann levels often become crowded and produce multiple fake-outs. Waiting until price breaks the range with increased momentum usually delivers cleaner setups.
Trading forex carries substantial risk. No indicator guarantees profits. Every trade should include a predefined stop-loss and position size based on account risk.
Best Settings and Practical Adjustments
Most Gann Square Indicator MT4 versions allow traders to modify starting points, projection depth, colors, and displayed angles.
For shorter-term trading, many traders use:
- M15 to H1 charts for intraday opportunities.
- Swing lookback between 50 and 100 candles.
- Confirmation from candlestick patterns before entry.
For swing trading:
- H4 and Daily charts generally produce more reliable Gann levels.
- Larger projection ranges help identify future support and resistance zones.
- Combining the indicator with Fibonacci retracement improves confidence when both tools identify similar price areas.
Gold (XAU/USD) can produce wider price swings than major currency pairs. Because of this, traders often increase their stop-loss distance instead of expecting the same reaction size seen on EUR/USD.
Advantages, Limitations, and Comparison with Other Indicators
The Gann Square Indicator MT4 offers several practical strengths. It helps traders anticipate possible reaction zones before price arrives. It also encourages patience by identifying areas where confirmation should appear instead of promoting impulsive entries.
Another advantage is its flexibility. The indicator works across multiple markets including forex, commodities, and indices while supporting different trading styles.
But there are limitations.
The starting swing point greatly affects projected levels. Two traders selecting different swing highs may generate different trading zones. Market conditions also matter. During strong news releases or unusually volatile sessions, price may move well beyond projected levels before stabilizing.
Compared with Pivot Points, the Gann Square provides more dynamic projections instead of relying only on previous session prices. Against Fibonacci Retracement, it places greater emphasis on price-time relationships rather than percentage retracement levels. Trend indicators like Moving Averages remain better for confirming direction, while the Gann Square focuses on identifying potential reaction areas.
Many experienced traders combine all three rather than depending on only one technical tool.
As trading experience grows, the indicator becomes less about finding exact turning points and more about identifying locations where extra confirmation deserves attention.
How to Trade with Gann Square Indicator MT4
Buy Entry

- Buy at Gann Square support – Enter after a bullish rejection candle on the 1-hour EUR/USD chart.
- Wait for candle confirmation – Buy only after a full candle closes above the Gann level.
- Trade with the trend – Take buy setups only when the 4-hour trend remains bullish.
- Place stop-loss below swing low – Keep it 20-35 pips below the recent support level.
- Target the next Gann level – Aim for a reward at least 1.5 to 2 times your risk.
- Confirm with higher timeframe – Daily trend should support the buying direction.
- Risk only 1-2% per trade – Protect your account during losing streaks.
- Avoid major news events – Skip buy entries before NFP or high-impact economic releases.
Sell Entry

- Sell at Gann Square resistance – Enter after a bearish rejection candle on the 1-hour GBP/USD chart.
- Wait for bearish close – Sell only after price closes below the projected Gann level.
- Follow the downtrend – Look for sell signals when the 4-hour trend is bearish.
- Set stop-loss above swing high – Place it 20-35 pips above the resistance area.
- Aim for the next support – Use the following Gann level as the profit target.
- Confirm with price action – A bearish engulfing candle improves trade quality.
- Limit risk to 1-2% – Never increase lot size to recover previous losses.
- Avoid sideways markets – Don’t trade when EUR/USD or GBP/USD is stuck in a tight range.
The Gann Square Indicator MT4 gives traders another way to study market structure instead of relying solely on lagging indicators. It helps identify projected support and resistance levels, works well alongside price action, encourages disciplined trade entries, and performs better when used with trend confirmation and proper risk management. At the same time, traders should recognize that changing market conditions can reduce its accuracy, especially during high-impact news events. Used with realistic expectations and consistent testing on a demo account, the Gann Square Indicator MT4 can become a valuable addition to a balanced trading strategy rather than a standalone decision-making tool.
Recommended MT4/MT5 Broker
XM Broker
- *FREE $50 To Start Trading Instantly! (Withdraw-able Profit)
- Deposit Bonus up to $5,000
- Unlimited Loyalty Program
- Award Winning Forex Broker
- Additional Exclusive Bonuses Throughout The Year


>> Sign Up for XM Broker Account here <<
(Free MT4 Indicators Download)




