


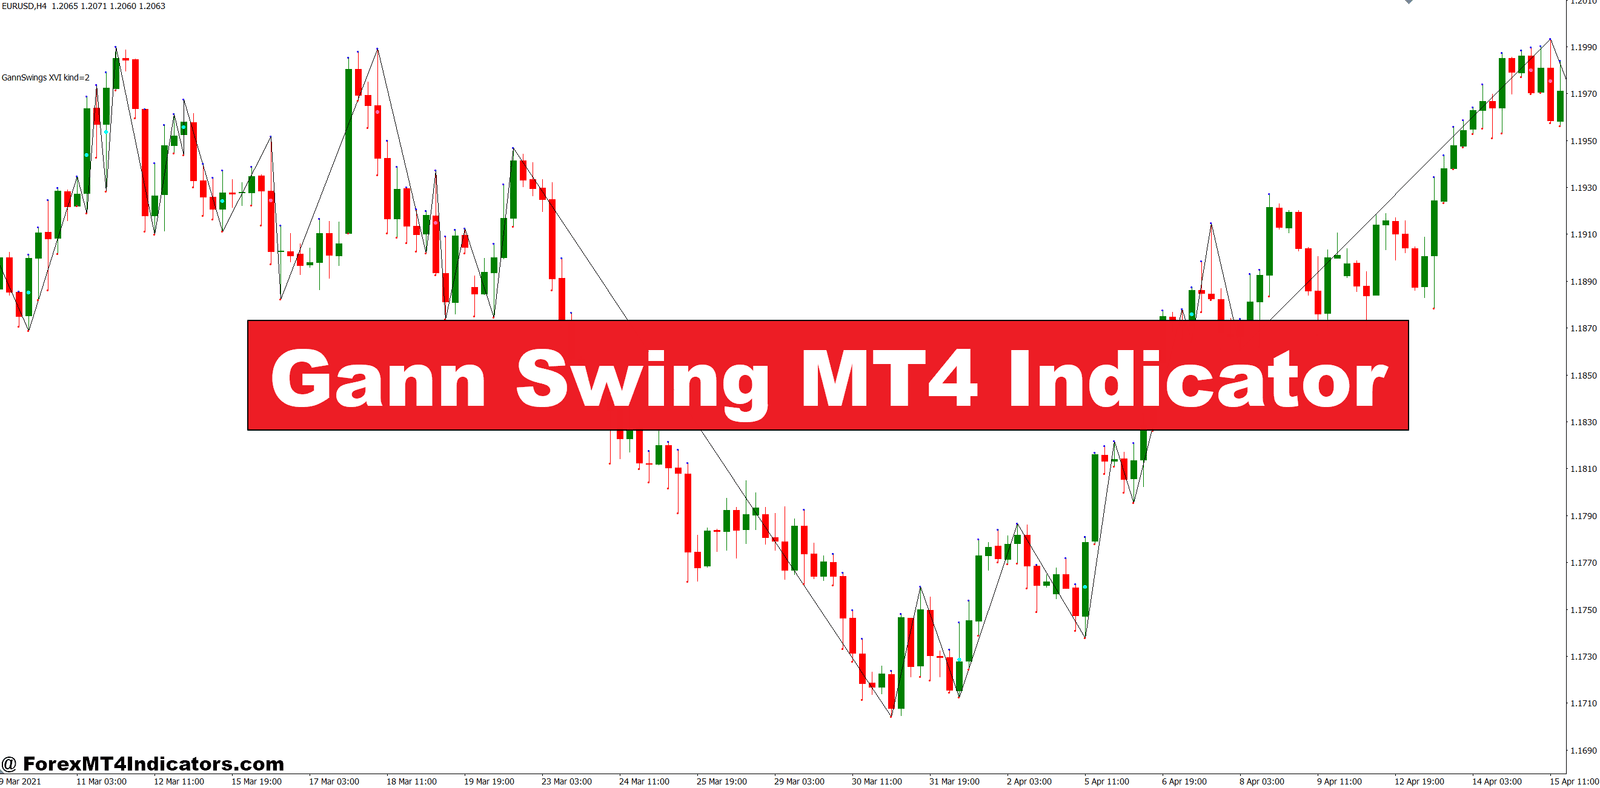

The Gann Swing indicator identifies and marks swing highs and swing lows on a chart. These aren’t just any price peaks or valleys—they’re significant pivot points where price has demonstrated a clear change in direction. W.D. Gann, the legendary trader from the early 1900s, developed specific rules for defining these swings, and this indicator applies those rules automatically.
A swing high forms when price makes a higher high that’s then followed by a lower high. Conversely, a swing low occurs when price makes a lower low followed by a higher low. The indicator plots lines connecting these pivots, creating a visual map of market structure. Traders see at a glance whether price is making higher highs and higher lows (uptrend) or lower highs and lower lows (downtrend).
What separates this from simple zigzag indicators is the specific calculation method. The Gann Swing requires a minimum number of bars (typically 2-3) to confirm a swing point. This filter reduces false signals during choppy consolidation periods.
How Traders Apply This in Real Scenarios

On a GBP/JPY 4-hour chart during last year’s volatile sessions, the indicator marked a clear swing low at 178.40 after price bounced three times off that level. Traders watching this saw the swing marker appear and could place buy orders above the swing high, using the swing low as a stop-loss reference. The risk was defined, the market structure was clear, and the trade made sense within the context of an emerging uptrend.
That’s the practical value right there. The indicator removes subjectivity from swing identification. When price breaks a previous swing high in an uptrend, it signals continuation strength. If price fails to break the last swing high and instead breaks the previous swing low, the trend might be weakening or reversing.
Here’s a common setup: A trader spots EUR/USD making a series of higher swing lows on the 1-hour chart. Each time price pulls back, it finds support above the last swing low. This pattern gives confidence to stay long. But if price suddenly breaks below the most recent swing low, that’s a warning sign—time to tighten stops or exit the position entirely.
The indicator works on any timeframe, though traders often favor the H1, H4, and daily charts for swing trading. Scalpers on M5 or M15 charts might find it generates too many signals, creating more noise than value during tight ranges.
Settings That Make a Difference

Most versions of the Gann Swing indicator allow adjustment of the swing period parameter. The default is often set to 2 or 3, meaning the indicator needs 2-3 bars to confirm a swing point. Increasing this value to 4 or 5 creates fewer, more significant swings—useful for traders who want to focus on major market structure rather than every minor pivot.
For AUD/USD on a daily chart, using a swing period of 3 works well for identifying weekly support and resistance zones. Traders looking at the same pair on a 15-minute chart might drop the period to 2 to catch intraday swings without too much lag.
Color and line style settings are mostly cosmetic, but some traders color-code upswings (green) and downswings (red) for faster visual recognition. The key is finding settings that match your trading style and timeframe. Day traders need more responsive settings; position traders need fewer, more robust signals.
One practical tip: Test different swing periods on your preferred pairs during both trending and ranging conditions. What works great during a strong EUR/GBP trend might produce choppy signals when the pair consolidates for two weeks.
Advantages and Honest Limitations
The biggest advantage? Objectivity. The indicator marks swings based on defined rules, not emotions or guesswork. When you’re deep in a trade and price is bouncing around, it’s easy to see what you want to see. The indicator doesn’t have that problem—it just marks the facts.
It also helps with trade management. Trailing a stop-loss below each new swing low in an uptrend is a straightforward, mechanical approach that lets profits run while limiting risk. Many traders struggle with exit discipline, and having clear swing markers removes some of that internal debate.
But here’s the reality: The Gann Swing indicator is a lagging tool. It confirms swings after they’ve formed, which means you’re never catching the exact high or low in real-time. By the time the indicator confirms a swing low, price has already moved higher. That’s fine for swing traders with patience, but frustrating for anyone trying to nail perfect entries.
The indicator also struggles during low-volatility chop. When price moves sideways in a tight range, swing markers can appear and disappear as price makes minor pivots that don’t lead anywhere meaningful. USD/JPY grinding in a 50-pip range over three days will generate swing signals that don’t reflect actual trend changes.
Trading forex carries substantial risk. No indicator guarantees profits, and the Gann Swing is no exception. It’s a tool for reading market structure, not a magic solution that predicts the future.
How It Compares to Similar Tools
Zigzag indicators share some DNA with the Gann Swing—both identify pivots and connect them with lines. But zigzag indicators typically use a percentage-based filter (like 5% or 10% retracement), while Gann Swing uses a bar-count method. This makes the Gann approach more time-based and less sensitive to sudden spikes.
Pivot point indicators mark mathematical levels based on previous period high, low, and close prices. They’re forward-looking reference points, whereas Gann Swings mark historical pivots where price actually turned. Some traders use both: pivot points for potential support/resistance, Gann Swings for confirming actual market behavior at those levels.
The Fractal indicator, another Bill Williams tool, marks specific candlestick patterns indicating potential reversals. It’s faster than Gann Swing but generates more false signals. Gann requires more confirmation, which reduces noise but adds lag.
How to Trade with Gann Swing MT4 Indicator
Buy Entry

- Wait for swing low confirmation – Enter long only after the indicator marks a clear swing low and price bounces at least 15-20 pips above it on EUR/USD 1-hour charts, confirming the pivot holds.
- Look for higher swing lows pattern – When you spot three consecutive swing lows, each higher than the last on GBP/USD 4-hour charts, buy on the pullback to the most recent swing low with a 30-pip stop below it.
- Break above previous swing high – Go long when price closes above the last swing high by at least 10 pips on the daily chart, signaling uptrend continuation with the previous swing low as your stop-loss reference.
- Combine with support zones – Only take buy signals when the swing low forms at a major support level or psychological round number (like 1.0800 on EUR/USD), adding confluence to your entry.
- Avoid during ranging conditions – Skip buy setups when the last 20-30 bars show multiple swing highs and lows within a tight 40-50 pip range, indicating choppy price action that generates false signals.
- Trail stops below each new swing low – Once in a buy position, move your stop-loss to 5-10 pips below each newly formed swing low to lock in profits while letting the trend run.
- Check higher timeframe alignment – Before entering on a 1-hour swing low signal, confirm the 4-hour or daily chart also shows an uptrend structure to avoid counter-trend trades.
- Set risk at 1-2% per trade – Never risk more than 2% of your account on a single Gann Swing signal, as even confirmed swings can fail when market conditions shift unexpectedly.
Sell Entry

- Wait for swing high confirmation – Enter short only after the indicator marks a definite swing high and price drops at least 15-20 pips below it on EUR/USD 1-hour charts, confirming bearish rejection.
- Look for lower swing highs pattern – When you identify three consecutive swing highs, each lower than the previous one on GBP/JPY 4-hour charts, sell on the rally to the most recent swing high with a 30-pip stop above it.
- Break below previous swing low – Go short when price closes below the last swing low by at least 10 pips on daily charts, confirming downtrend momentum with the previous swing high as your stop reference.
- Combine with resistance zones – Only take sell signals when the swing high forms at a major resistance level or previous support-turned-resistance, giving you multiple reasons for the trade setup.
- Skip signals during Friday afternoons – Avoid shorting on swing high signals after 12 PM EST on Fridays when liquidity drops and weekend gaps can trigger your stop-loss unpredictably.
- Trail stops above each new swing high – Once in a short position, adjust your stop-loss to 5-10 pips above each newly formed swing high to protect profits while staying in the downtrend.
- Verify momentum with lower timeframe – Before shorting on a 4-hour swing high, check the 1-hour chart shows consistent lower highs and lower lows to confirm the downward pressure is real.
- Never add to losing positions – If price breaks above your entry swing high, exit immediately rather than averaging down, as the market structure has already invalidated your original signal.
Final Perspective
The Gann Swing MT4 Indicator gives traders a clear, objective way to read market structure through swing highs and lows. It won’t predict the next market move, but it shows where the market has actually turned—information that matters when planning entries, setting stops, and managing open positions. The tool works best for swing traders and position traders who base decisions on market structure rather than trying to catch every minor fluctuation.
That said, it’s not perfect. The lag inherent in confirming swings means you’ll never catch the exact turning points, and choppy markets will generate misleading signals. Pair this indicator with volume analysis, support/resistance zones, or momentum tools to build a more complete trading system. Test it thoroughly on demo accounts across different market conditions before risking real money. The traders who benefit most are those who understand both its strengths and limitations—and who use it as one piece of a larger trading puzzle, not a standalone solution.
Recommended MT4/MT5 Broker
XM Broker
- Free $50 To Start Trading Instantly! (Withdraw-able Profit)
- Deposit Bonus up to $5,000
- Unlimited Loyalty Program
- Award Winning Forex Broker
- Additional Exclusive Bonuses Throughout The Year
- Exclusive 90% VIP Cash Rebates for all Trades!


Already an XM client but missing out on cashback? Open New Real Account and Enter this Partner Code: VIP90


