






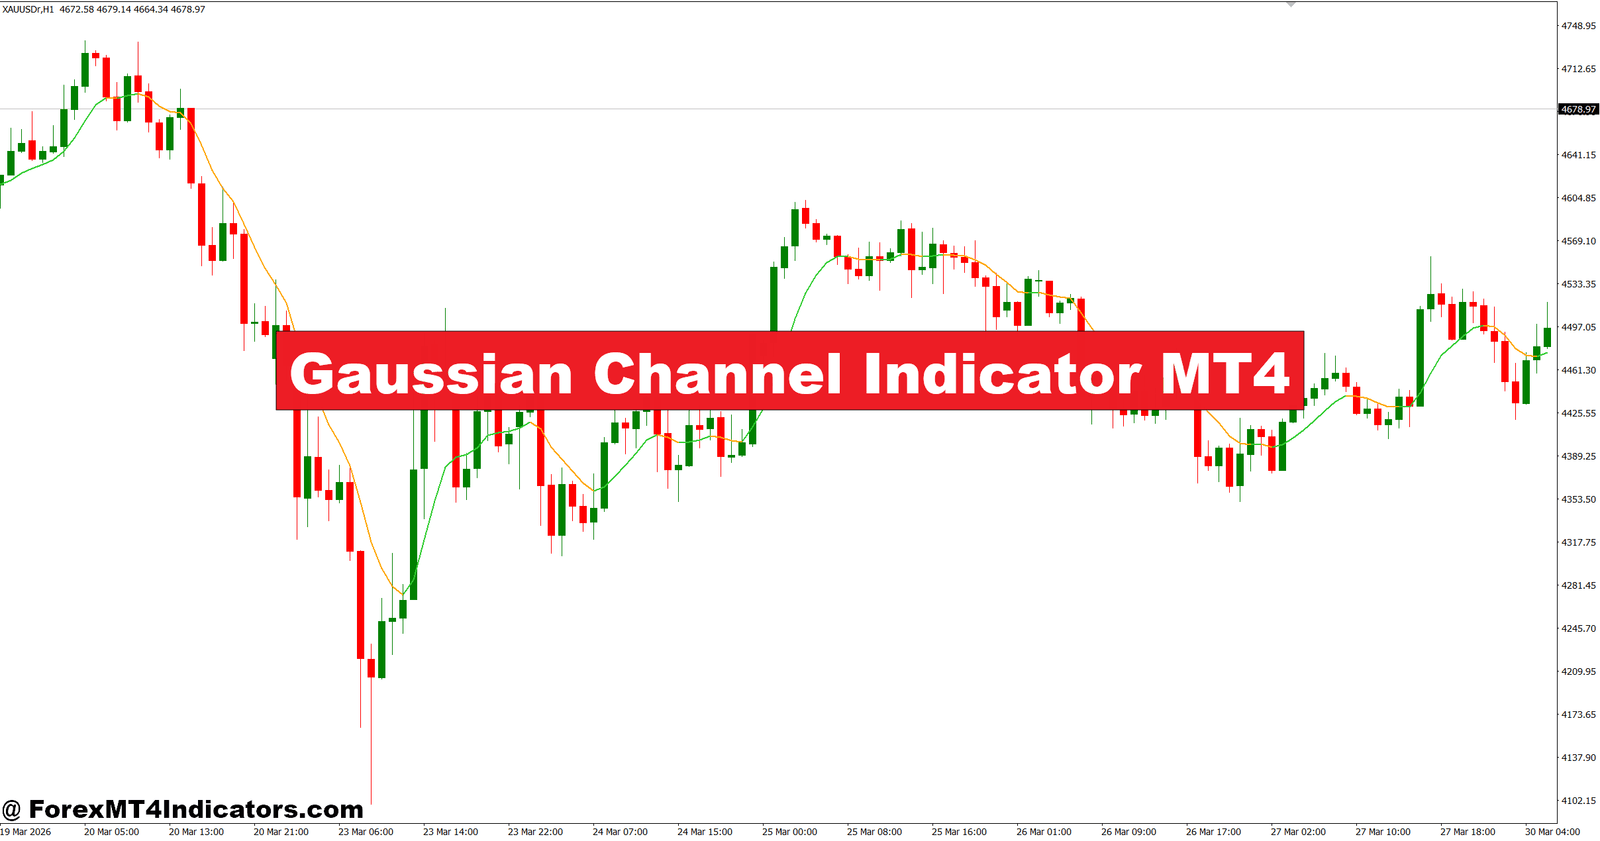
The Gaussian Channel Indicator MT4 was created to help reduce that problem by showing a smoother view of price action while filtering much of the market noise that causes poor trading decisions.
A trader who relies only on raw price movement often reacts to every small swing. During ranging markets, that can lead to repeated losses and emotional trading. Even experienced traders get caught in whipsaws when volatility suddenly increases around major news events or market opens.
The Gaussian Channel Indicator MT4 offers a different approach. It builds a dynamic price channel around a smoothed trend line, helping traders judge trend direction, identify potential pullbacks, and avoid many low-quality setups. Used alongside sound risk management and price action analysis, it can become a practical addition to a trading plan.
Understanding the Gaussian Channel Indicator MT4
The Gaussian Channel Indicator is a trend-following technical tool built around a Gaussian filter. Unlike a standard moving average, which simply averages historical prices, the Gaussian filter smooths price movement while attempting to reduce lag. The result is a center line that follows the market more naturally, with upper and lower bands forming a trading channel.
The channel expands during volatile periods and narrows when the market becomes quiet. This allows traders to quickly judge whether price is trending strongly or simply moving sideways.
Many traders compare it with Bollinger Bands because both create dynamic channels. The difference is that Bollinger Bands rely heavily on standard deviation, while the Gaussian Channel focuses more on filtering price fluctuations before creating the bands. That often produces cleaner trend signals during steady market conditions.
How the Indicator Calculates Market Direction
At its core, the indicator applies several stages of Gaussian smoothing to historical prices. Instead of reacting sharply to every candle, it filters smaller fluctuations that often create fake trading signals.
After calculating the smoothed center line, the indicator measures market volatility to position the upper and lower channel boundaries. Those bands adjust automatically as volatility changes.
Here’s how traders often interpret the signals:
- Price consistently above the center line suggests bullish momentum.
- Price below the center line indicates bearish pressure.
- A touch of the lower band during an uptrend may signal a buying opportunity.
- A rejection from the upper band during a downtrend may offer a potential sell setup.
For example, EUR/USD on the 1-hour chart may remain above the center line for several sessions while repeatedly bouncing from the lower channel. Instead of chasing every bullish candle, a trader can wait for price to return near the lower band before looking for confirmation from bullish candlestick patterns.
When testing this indicator during volatile Non-Farm Payroll (NFP) releases, many traders notice that sudden spikes can temporarily push price outside the channel. Waiting for the first candle to close after the news often produces more reliable signals than entering immediately during the announcement.
Applying the Gaussian Channel in Live Trading

The indicator works best when combined with market structure rather than treated as a standalone entry system.
Imagine GBP/USD on the 4-hour timeframe. The market has been making higher highs and higher lows for several days. Price pulls back toward the lower Gaussian Channel while approaching a previous support level.
Instead of buying immediately, a trader waits for:
- A bullish engulfing candle
- Rising trading volume
- RSI moving back above 50
When these conditions align, the trade has multiple layers of confirmation instead of relying on a single indicator.
The same idea applies to sell trades. Suppose USD/JPY is trending lower on the daily chart. Price rallies into the upper channel while reaching previous resistance. A bearish pin bar forms, and the MACD histogram begins to weaken. That combination provides stronger evidence than the channel alone.
One practical lesson learned through testing is that the indicator performs much better in trending markets than during tight consolidation. When the channel becomes nearly flat and price crosses it repeatedly, traders are often better off waiting for a clear breakout before considering new positions.
Trading forex carries substantial risk. No indicator guarantees profits.
Best Settings and Customization
The default settings usually work well for many currency pairs, but experienced traders often make small adjustments depending on the trading style.
Scalping
For 5-minute and 15-minute charts:
- Faster Gaussian period between 15 and 25
- Combine with session timing during London or New York opens
- Avoid trading during very low liquidity periods
Intraday Trading
For 1-hour charts:
- Gaussian period around 40–60
- Works well with EUR/USD, GBP/USD, and USD/CAD
- Confirm entries using support and resistance zones
Swing Trading
For 4-hour and daily charts:
- Period between 70 and 120
- Focus on larger trend continuation setups
- Allow wider stop-loss distances of 50 to 120 pips depending on volatility
Higher settings create smoother channels but respond more slowly to changing trends. Lower settings react faster but may produce more false signals during choppy conditions.
Strengths, Weaknesses, and Comparison with Similar Indicators
Every technical indicator has strengths and trade-offs. The Gaussian Channel is no exception.
One of its biggest advantages is smoother trend identification. Because the Gaussian filter reduces random price movement, traders often experience fewer false entries than when using a simple moving average crossover.
Another benefit is the adaptive channel width. During high volatility, the channel expands naturally instead of keeping fixed distances from price. This helps traders judge whether current market movement is normal or unusually aggressive.
Still, there are situations where it struggles.
Sharp reversals after unexpected economic news can create delayed reactions because smoothing always introduces some lag. Fast-moving markets may reverse before the indicator fully adjusts. That’s why experienced traders rarely depend on the channel by itself.
Compared with Keltner Channels, the Gaussian Channel generally produces smoother trend visualization. Against Bollinger Bands, it often filters short-term noise more effectively during sustained trends. Simple moving averages remain useful for basic trend direction, but they don’t provide the dynamic support and resistance zones created by the channel bands.
Price action should remain the final decision-maker. The indicator simply adds another layer of evidence.
How to Trade with Gaussian Channel Indicator MT4
Buy Entry

- Buy on Lower Channel Bounce – Enter when EUR/USD on the 1-hour chart rejects the lower channel with a bullish candle. Aim for 30–60 pips.
- Confirm the Uptrend – Buy only if price stays above the channel midline and forms higher highs on the 4-hour chart.
- Wait for Candle Close – Enter after the signal candle closes to avoid fake-outs. Place a 20–35 pip stop-loss.
- Trade with Trend – Buy pullbacks instead of chasing breakouts when the channel slopes upward.
- Use Multi-Timeframe Confirmation – Check the daily trend before buying on the 1-hour chart for higher-probability trades.
- Manage Risk – Risk only 1–2% of account balance and target at least a 1:2 risk-to-reward ratio.
- Avoid Flat Channels – Skip buy signals when the channel is horizontal and price keeps crossing both bands.
- Stay Out During Major News – Avoid buying before high-impact events like NFP or FOMC announcements.
Sell Entry

- Sell on Upper Channel Rejection – Enter when GBP/USD on the 1-hour chart rejects the upper channel with a bearish candle. Target 30–60 pips.
- Confirm the Downtrend – Sell only if price remains below the channel midline on the 4-hour timeframe.
- Wait for Bearish Close – Enter after the confirmation candle closes. Keep the stop-loss around 20–35 pips.
- Follow Trend Direction – Sell rallies during a downward-sloping channel instead of selling market lows.
- Check Higher Timeframe – Confirm the daily trend before taking sell entries on lower timeframes.
- Protect Capital – Risk no more than 1–2% per trade and secure partial profits after 30–40 pips.
- Avoid Sideways Markets – Don’t sell when the channel is flat and price shows no clear direction.
- Skip High-Volatility Releases – Avoid sell entries during major economic news when price can break both channel bands.
Final Thoughts
The Gaussian Channel Indicator MT4 gives traders a cleaner way to read market direction by combining trend filtering with adaptive price channels. It helps identify pullbacks, highlights stronger trend continuation opportunities, and reduces some of the market noise that causes unnecessary trades. At the same time, it isn’t designed to predict every reversal, and it performs best when paired with support and resistance, candlestick confirmation, and disciplined risk management. Traders who spend time testing the Gaussian Channel Indicator MT4 on different currency pairs and timeframes will gain a better understanding of where it fits within their overall trading strategy rather than expecting it to generate every trading decision on its own.
Recommended MT4/MT5 Broker
XM Broker
- *FREE $50 To Start Trading Instantly! (Withdraw-able Profit)
- Deposit Bonus up to $5,000
- Unlimited Loyalty Program
- Award Winning Forex Broker
- Additional Exclusive Bonuses Throughout The Year


>> Sign Up for XM Broker Account here <<
(Free MT4 Indicators Download)




