


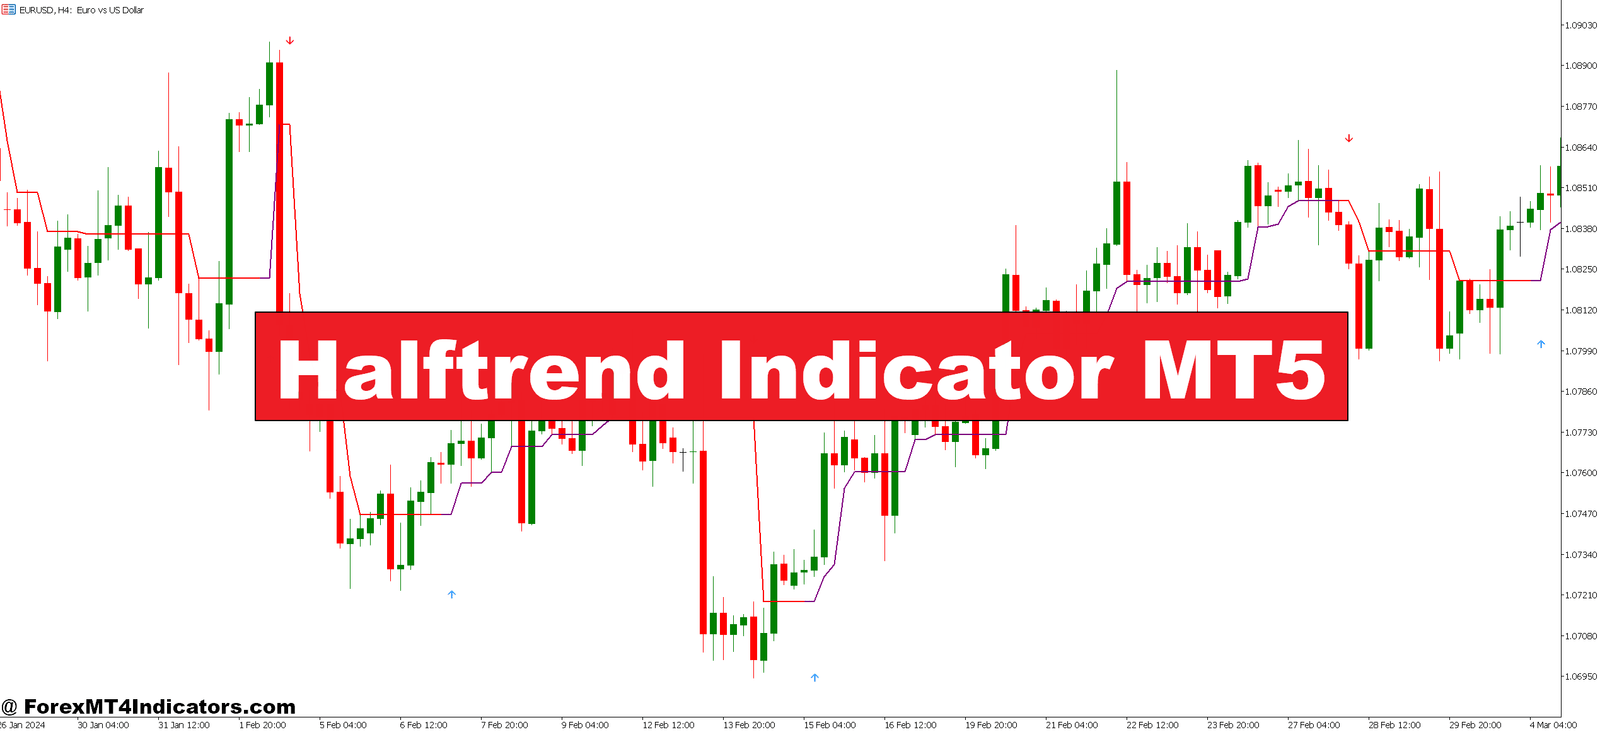

The Halftrend Indicator is a trend-following technical analysis tool that identifies directional bias by analyzing the relationship between recent highs, lows, and a smoothed average. It displays results as colored price bars—typically blue for uptrends and red for downtrends—with directional arrows marking potential entry points when the trend flips.
What sets it apart? Most indicators use a single smoothing method (like an exponential moving average) that creates lag. Halftrend employs a dual calculation approach that tracks both the upper and lower extremes of price action. When price breaks through the Halftrend line decisively, the indicator doesn’t just change color gradually—it snaps to the new direction and stays locked until genuine reversal conditions emerge.
This behavior reduces false signals during ranging markets. The indicator won’t flip back and forth five times during a tight consolidation like a standard MACD or Stochastic might. That’s the practical advantage traders actually notice when running it on 15-minute or 1-hour charts.
The Calculation Logic Behind Halftrend
Understanding how Halftrend works helps you trust its signals. The indicator calculates an average of high and low prices over a specified period (default is usually 2), then adjusts this value using the Average True Range (ATR) as a multiplier. This ATR component acts as a volatility filter—wider during volatile sessions, tighter during calm periods.
Here’s the basic logic: The indicator creates an upper band and lower band around price. When price closes above the upper band, Halftrend confirms an uptrend and plots blue bars. When price closes below the lower band, it confirms a downtrend and plots red bars. The trend doesn’t flip until price makes a definitive move beyond the opposing band, which is why you don’t see the constant color changes that plague simpler indicators.
The amplitude setting controls how sensitive these bands are. A higher amplitude value (say, 3 instead of 2) makes the indicator less reactive, requiring stronger moves to trigger trend changes. Lower values increase sensitivity but also increase false signals during choppy conditions. That’s the tradeoff traders need to balance based on their timeframe and trading style.
Real Trading Scenarios with Halftrend

Let’s get specific. On a typical Wednesday morning in London session, EUR/USD might open at 1.0850 and start grinding higher. Your 1-hour chart shows Halftrend has been red (downtrend) since the previous day. At 8:45 AM GMT, price breaks above 1.0875 and Halftrend flips to blue with an upward arrow. This is the signal many traders use to enter long positions.
The indicator stays blue as price climbs to 1.0920 over the next three hours. Minor pullbacks to 1.0900 don’t change the color—the Halftrend line simply adjusts slightly lower while maintaining its blue designation. This is where the indicator shines. You’re not getting shaken out by every small retracement like you would with a 20-period EMA crossover system.
But here’s the thing: Halftrend doesn’t predict reversals. It confirms them after they’ve started. That means your entry on the flip from red to blue at 1.0875 came after price had already moved 25 pips from the low. Some traders call this “entering late,” but others recognize it as the cost of confirmation. You’re paying a few pips to avoid the fake-outs that would’ve triggered stop losses in a less filtered system.
On 15-minute GBP/JPY charts during Tokyo session, I’ve noticed Halftrend performs poorly. The pair tends to range more than trend during those hours, and the frequent color changes generate marginal trades with tight profit targets. The indicator works best when volatility and directional bias align—think New York session EUR/USD or London session cable (GBP/USD).
Customizing Halftrend Settings for Your Trading

The two main parameters you’ll adjust are amplitude and period. Period determines how many bars the indicator uses in its calculation, while amplitude controls the sensitivity of trend detection. Default settings often sit around 2 for amplitude and 2 for period, but these need adjustment based on your timeframe.
For day trading on 5-minute charts, reducing amplitude to 1.5 captures shorter trend bursts. You’ll get more signals, which means more opportunities but also more false starts during ranges. Swing traders working with 4-hour or daily charts typically increase amplitude to 3 or even 4. This filters out intraday noise and keeps them focused on multi-day directional moves.
Here’s a practical tip: Test Halftrend on multiple timeframes simultaneously. If the 15-minute, 1-hour, and 4-hour charts all show blue (uptrend) on USD/CAD, that’s confluence suggesting stronger probability than a single timeframe signal. When lower timeframes conflict with higher ones, the whipsaw risk increases significantly.
Some traders combine Halftrend with support and resistance zones. They only take Halftrend signals that align with key levels. For example, if Halftrend flips bullish (blue) right as EUR/USD bounces off the 1.0800 psychological level, that’s a higher-probability setup than a random midrange signal at 1.0845.
The Honest Truth: Advantages and Limitations
Halftrend excels at keeping traders in trending moves longer than standard moving average systems. The reduced noise means fewer stop-outs during minor retracements, which preserves capital and reduces the emotional toll of constant losses. For traders who struggle with premature exits, this indicator provides a clear visual framework to stay patient.
The signals are unambiguous. Blue bars mean buy bias, red bars mean sell bias. No complex interpretation required, which helps newer traders avoid analysis paralysis. The arrow markers make entry timing straightforward—wait for the flip, enter on confirmation, manage risk with a stop below the Halftrend line.
But let’s be clear about limitations. Halftrend is a lagging indicator by design. It waits for price confirmation before changing direction, which means you’ll never catch the absolute top or bottom of a move. In fast-reversing markets like NFP announcements or central bank decisions, Halftrend might flip too late, giving back significant profits before signaling an exit.
The indicator also struggles in low-volatility environments. When EUR/USD trades in a 30-pip range for hours, Halftrend might oscillate between colors or produce marginal signals that lead to small losses. It’s not designed for range-bound trading—period. Traders need companion tools like Bollinger Bands or ATR readings to identify when markets aren’t conducive to trend-following approaches.
One more thing: No indicator guarantees profits. Trading forex carries substantial risk of loss. Halftrend, like any technical tool, produces losing trades. Risk management—position sizing, stop losses, maximum daily drawdown rules—matters more than the indicator itself. Don’t confuse a clear signal with a certain outcome.
How to Trade with Halftrend Indicator MT5
Buy Entry

- Wait for blue bar confirmation – Enter long only after Halftrend plots a blue bar with an upward arrow, not during the color transition from red to blue.
- Check higher timeframe alignment – Verify the 4-hour or daily chart shows blue trend before taking 1-hour buy signals on EUR/USD or GBP/USD for stronger probability.
- Place stop loss 10-15 pips below Halftrend line – Position your stop beneath the indicator’s current level to allow breathing room while protecting against genuine reversals.
- Enter on pullback, not chase – If price jumps 30+ pips after the blue signal appears, wait for a 50% retracement back to the Halftrend line before entering.
- Avoid buy signals during major resistance – Skip long entries when price hits psychological levels like 1.1000 on EUR/USD or key daily highs, even if Halftrend turns blue.
- Require 2:1 minimum risk-reward – Target at least 40 pips profit if your stop is 20 pips; Halftrend trends often extend 60-100 pips on 1-hour charts.
- Skip choppy Asian session signals – Ignore Halftrend flips during low-volume periods (1:00-6:00 AM GMT) when ranges compress below 20 pips on major pairs.
- Exit when Halftrend turns red – Close long positions immediately when the indicator plots a red bar, regardless of your profit target or personal bias.
Sell Entry

- Enter short on red bar with down arrow – Take sell positions only after Halftrend confirms downtrend with red color and directional arrow, not before.
- Confirm with falling highs pattern – Look for lower swing highs on the chart before entering; don’t short if price is making higher highs despite red Halftrend.
- Set stop 10-15 pips above Halftrend line – Place stops above the indicator’s level, adjusted for pair volatility (GBP/USD needs wider stops than EUR/USD).
- Reduce position size by 50% at support zones – When shorting into major support like 1.0800 on EUR/USD, cut your lot size in half to manage reversal risk.
- Avoid sells during NFP or central bank events – Skip any red signals within 2 hours of high-impact news releases that can trigger sharp reversals against Halftrend.
- Trail stop to breakeven after 20-pip profit – Move your stop to entry price once trade moves favorably to eliminate risk while letting trend develop.
- Ignore signals in 15-20 pip ranges – Don’t take short entries when 4-hour ATR shows volatility below 25 pips; Halftrend generates false signals in tight consolidation.
- Exit immediately on blue flip – Close all short positions the moment Halftrend changes to blue, even if you’re down 10 pips; fighting the signal leads to larger losses.
Bringing It All Together
The Halftrend Indicator MT5 offers traders a practical way to ride trends while filtering out much of the noise that triggers premature exits and false entries. Its dual-band calculation method and volatility-adjusted design keep signals cleaner than basic moving average systems, especially during strong directional moves in major pairs like EUR/USD, GBP/USD, and USD/JPY. The visual simplicity—colored bars and arrows—removes interpretation guesswork, helping traders execute with more confidence.
That said, this isn’t a magic solution. Halftrend lags by design, struggles in choppy conditions, and requires proper timeframe selection to match your trading style. Combine it with solid risk management, test your settings in demo accounts, and use multiple timeframe analysis for confirmation. The indicator works best when you understand both what it does well and where it falls short. Master that balance, and you’ve got a tool worth keeping in your MT5 chart setup.
Recommended MT4/MT5 Broker
XM Broker
- Free $50 To Start Trading Instantly! (Withdraw-able Profit)
- Deposit Bonus up to $5,000
- Unlimited Loyalty Program
- Award Winning Forex Broker
- Additional Exclusive Bonuses Throughout The Year
- Exclusive 90% VIP Cash Rebates for all Trades!


Already an XM client but missing out on cashback? Open New Real Account and Enter this Partner Code: VIP90


