


The HH LL Indicator MT4 was built to solve exactly this problem. It automatically plots higher highs (HH), higher lows (HL), lower highs (LH), and lower lows (LL) directly on the chart, giving traders a clean visual map of where the trend stands — and more importantly, where it’s breaking down. Instead of guessing at swing points, the indicator marks them in real time.
Let’s get into how it works, how to set it up, and where it actually helps (and where it doesn’t).
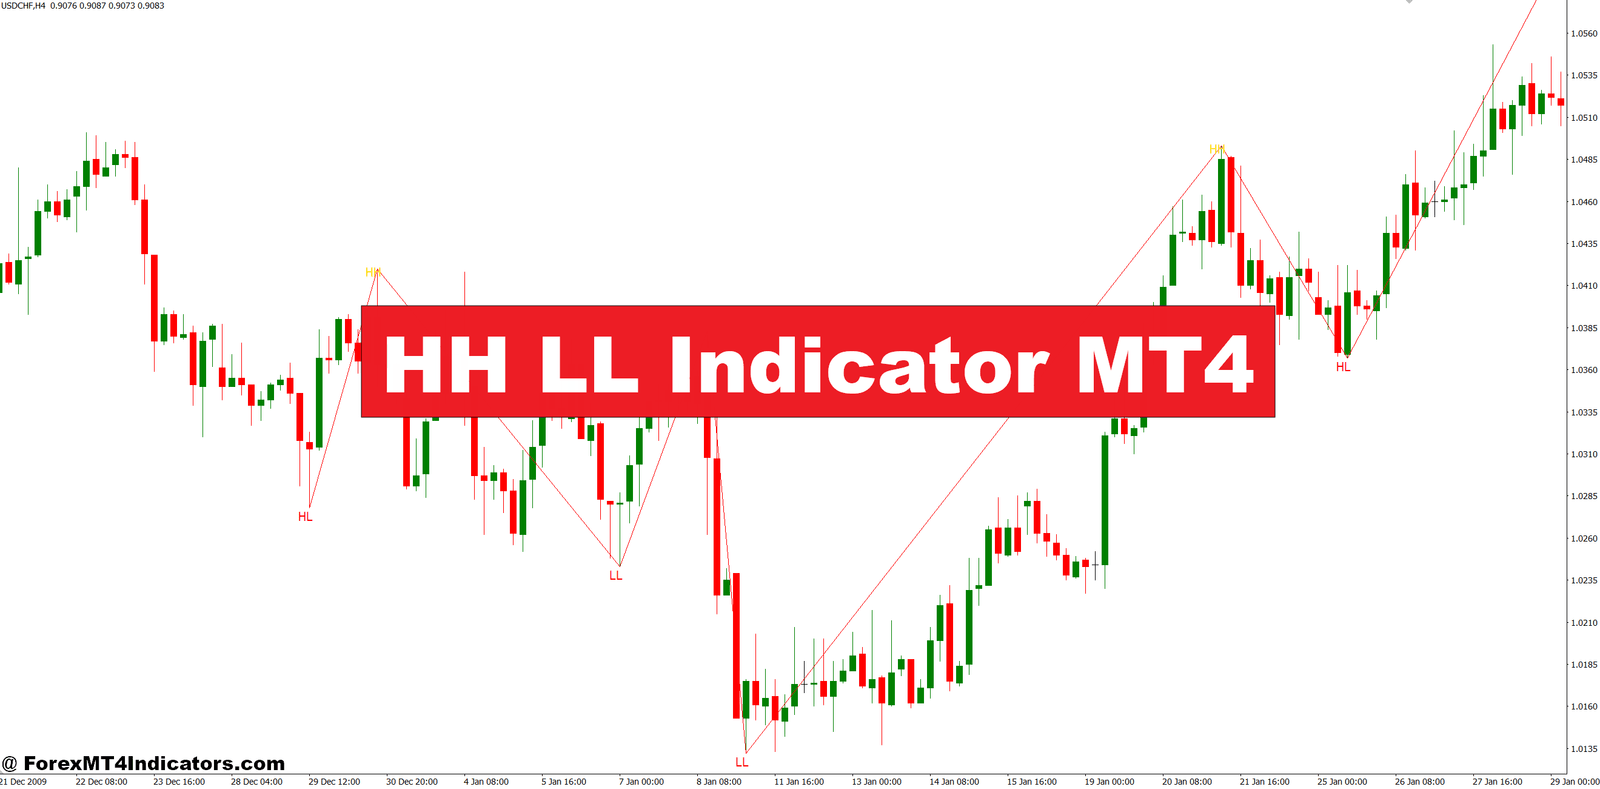
What the HH LL Indicator Actually Does
At its core, the HH LL Indicator MT4 is a swing-point detection tool. It identifies local price extremes — swing highs and swing lows — and then labels them based on their relationship to the previous swing.
If a new swing high is above the prior swing high, it prints “HH” on the chart. If a new swing low is above the prior swing low, you get “HL.” The opposite holds true for downtrends: a swing high below the prior one gets labeled “LH,” and a fresh low below the last one shows “LL.”
That’s market structure in its simplest form. Uptrends make higher highs and higher lows. Downtrends make lower highs and lower lows. When that sequence breaks — say, an uptrend prints its first lower low — that’s your early warning that momentum is shifting. The indicator puts that information right on the candles so you don’t have to manually track every swing.
Some versions of the indicator also draw connecting lines between swing points or change label colors based on trend direction. These visual cues make it faster to scan multiple pairs and timeframes without second-guessing your own markup.
How the Swing Detection Logic Works

The indicator uses a lookback period — typically between 3 and 10 bars — to confirm swing points. Here’s the logic: a swing high forms when a candle’s high is greater than the highs of the n candles on either side of it. A swing low is the mirror image. The parameter usually labeled “Depth” or “Period” controls how many bars the algorithm checks.
A setting of 5, for example, means the indicator waits for 5 candles on each side of a potential swing point before confirming it. Lower values (like 3) pick up smaller, more frequent swings. Higher values (8-10) filter out minor noise and focus on the dominant structure.
There’s a tradeoff here. A lower lookback catches shifts faster but generates more labels — some of which end up being noise during choppy sessions. A higher lookback gives fewer, more reliable signals but introduces lag. By the time the indicator confirms a structural break with a 10-bar depth, price may have already moved 30-40 pips past the turning point.
Most traders testing the HH LL Indicator MT4 find that a depth setting of 5 works well on the H1 and H4 timeframes for major pairs like GBP/USD and EUR/USD. On the 15-minute chart, dropping to 3 can help catch intraday structure shifts — though the noise level rises significantly during London-New York overlap hours.
Practical Trading Setups Using the Indicator
Trend Continuation Entries
One of the cleanest ways to use this tool is for pullback entries in a confirmed trend. Say AUD/USD on the H4 chart is printing a clear sequence: HH, HL, HH, HL. A trader waits for the next HL label to appear, then enters long with a stop just below that swing low. The target? The area near the most recent HH, or a measured move based on the prior swing range.
This approach keeps entries aligned with structure. It’s not exciting, but it works because you’re only taking trades in the direction the market is already telling you it wants to go.
Structural Break Trades
This is where the indicator earns its keep. Suppose USD/JPY has been trending up — HH, HL, HH, HL for the past two days. Then the indicator prints an “LL.” That lower low breaks the uptrend sequence and signals that sellers are stepping in with enough force to push below prior demand.
A trader might wait for the next rally after that LL print. If the bounce only reaches a lower high (LH), the new bearish structure is confirmed: LL followed by LH. That’s a short setup. Stop goes above the LH, and the target sits near recent support or the next round number.
During the September 2024 NFP release, this kind of structural break played out on GBP/USD within three hours on the M30 chart. The pair had been grinding higher all London session, then printed a sharp LL on the news spike. The following LH confirmed the flip, and price dropped another 45 pips into the New York afternoon. Traders who spotted the break early had a solid risk-to-reward entry.
Combining with Other Tools
The HH LL indicator works best when paired with other confirmation methods. Support and resistance zones give context to where structural breaks happen — a lower low that slices through a daily support level carries more weight than one that forms in the middle of nowhere. The 200 EMA is another useful filter: structural breaks that align with a moving average trend tend to follow through more consistently.
Some traders also overlay RSI divergence with the swing labels. If the indicator prints a higher high but RSI shows a lower high, that divergence flags potential exhaustion before the structure actually cracks.
Where the Indicator Falls Short

No tool is perfect, and honesty here matters more than hype. The HH LL Indicator MT4 repaints swing labels in most versions. That means the most recent label might shift or disappear as new candles form. Only confirmed (closed) swing points should be trusted for trade decisions. The “live” label on the current forming candle is tentative.
In ranging markets, the indicator can flip between HH/HL and LH/LL rapidly, producing whipsaw signals. If price is stuck between 1.0850 and 1.0900 on EUR/USD, the labels become noise rather than signal. Traders should recognize when a pair is range-bound and step aside or switch to a mean-reversion strategy instead.
And this tool won’t replace a complete trading plan. It identifies structure — nothing more. Risk management, position sizing, and broader market context (interest rate decisions, geopolitical events) still do the heavy lifting when it comes to consistent profitability.
Trading forex carries substantial risk. No indicator guarantees profits, and past structure patterns don’t ensure future results. Always use proper risk management and test any tool on a demo account before committing real capital.
How to Trade with HH LL Indicator MT4
Buy Entry

- Wait for HL confirmation – Only enter long after the indicator prints a higher low on a closed candle, not while the candle is still forming.
- Look for the HH-HL sequence – A valid buy setup needs at least two consecutive prints: one HH followed by one HL on the H1 or H4 chart.
- Enter at the HL bounce – Place your buy order 3-5 pips above the candle that confirmed the higher low, targeting the most recent HH level.
- Set stops below the HL label – Your stop-loss goes 8-12 pips beneath the confirmed higher low swing point to survive normal spread widening.
- Use the 200 EMA as a trend filter – Only take buy signals when price is trading above the 200 EMA on EUR/USD or GBP/USD to stay with the dominant trend.
- Check RSI for hidden bullish divergence – If price prints a higher low but RSI shows a lower low, the signal strengthens because momentum is coiling for a push up.
- Skip the signal during ranging markets – If the indicator has flipped between HH/HL and LH/LL three or more times in the last 20 candles, sit on your hands — that’s chop, not trend.
- Aim for 1:2 risk-to-reward minimum – If your stop is 25 pips, your target should be at least 50 pips away, ideally near the next resistance zone or prior HH.
Sell Entry

- Confirm the first LL print – A lower low breaking the prior uptrend sequence is your first structural warning — don’t short yet, but start watching for follow-through.
- Enter on the LH formation – The real sell trigger comes when the bounce after an LL only reaches a lower high. Go short 3-5 pips below that LH confirmation candle.
- Place stops above the LH label – Set your stop-loss 10-15 pips above the confirmed lower high to give the trade room without overexposing your account.
- Trade with the 200 EMA, not against it – On the 4-hour GBP/USD chart, short signals below the 200 EMA follow through far more reliably than those above it.
- Watch for bearish RSI divergence – If price made a higher high but the indicator now prints LH while RSI trends down, sellers are gaining control — that’s a high-probability short.
- Avoid selling into daily support zones – A fresh LL signal on the H1 means nothing if price is sitting right on a major daily support level 10 pips below. Context beats signals every time.
- Reduce size ahead of high-impact news – Cut your position by 50% if an NFP, CPI, or rate decision is within 2 hours of your entry. Structural signals get destroyed by volatility spikes.
- Target the prior LL or next support – Measure the distance from your entry to the most recent LL or a clean support zone, and use that as your take-profit area with a minimum 1:1.5 ratio.
Making the HH LL Indicator Work for You
The HH LL Indicator MT4 does one thing well: it takes the manual work out of tracking market structure. It labels swing points clearly, flags when trends are intact, and — most usefully — highlights the moment a trend sequence breaks. Traders who pair it with support/resistance levels, moving averages, or divergence signals can build a straightforward system around structural shifts.
That said, it won’t work in every market condition. Choppy, low-volume sessions produce messy labels, and the repainting issue means patience is required before acting on a fresh print. The sweet spot seems to be the H1 and H4 charts on liquid pairs, with a depth setting between 4 and 6.
If you’ve been struggling to read swing highs and lows consistently, this indicator is worth loading onto a demo chart for a few weeks. Track how its labels match up with your own markup. You might find it confirms what you already see — or catches shifts you would have missed.
Recommended MT4/MT5 Broker
XM Broker
- Free $50 To Start Trading Instantly! (Withdraw-able Profit)
- Deposit Bonus up to $5,000
- Unlimited Loyalty Program
- Award Winning Forex Broker
- Additional Exclusive Bonuses Throughout The Year
- Exclusive 90% VIP Cash Rebates for all Trades!


Already an XM client but missing out on cashback? Open New Real Account and Enter this Partner Code: VIP90


