


The Higher High Higher Low (HHHL) indicator for MT4 tackles this exact problem. It automatically identifies and marks swing highs and lows, helping traders confirm trend direction without the guesswork. Instead of squinting at charts trying to determine if that recent high truly exceeded the previous one, the indicator does the heavy lifting. This tool brings objective structure to price action analysis, something swing traders and trend followers desperately need.
What the Higher High Higher Low Indicator Actually Does
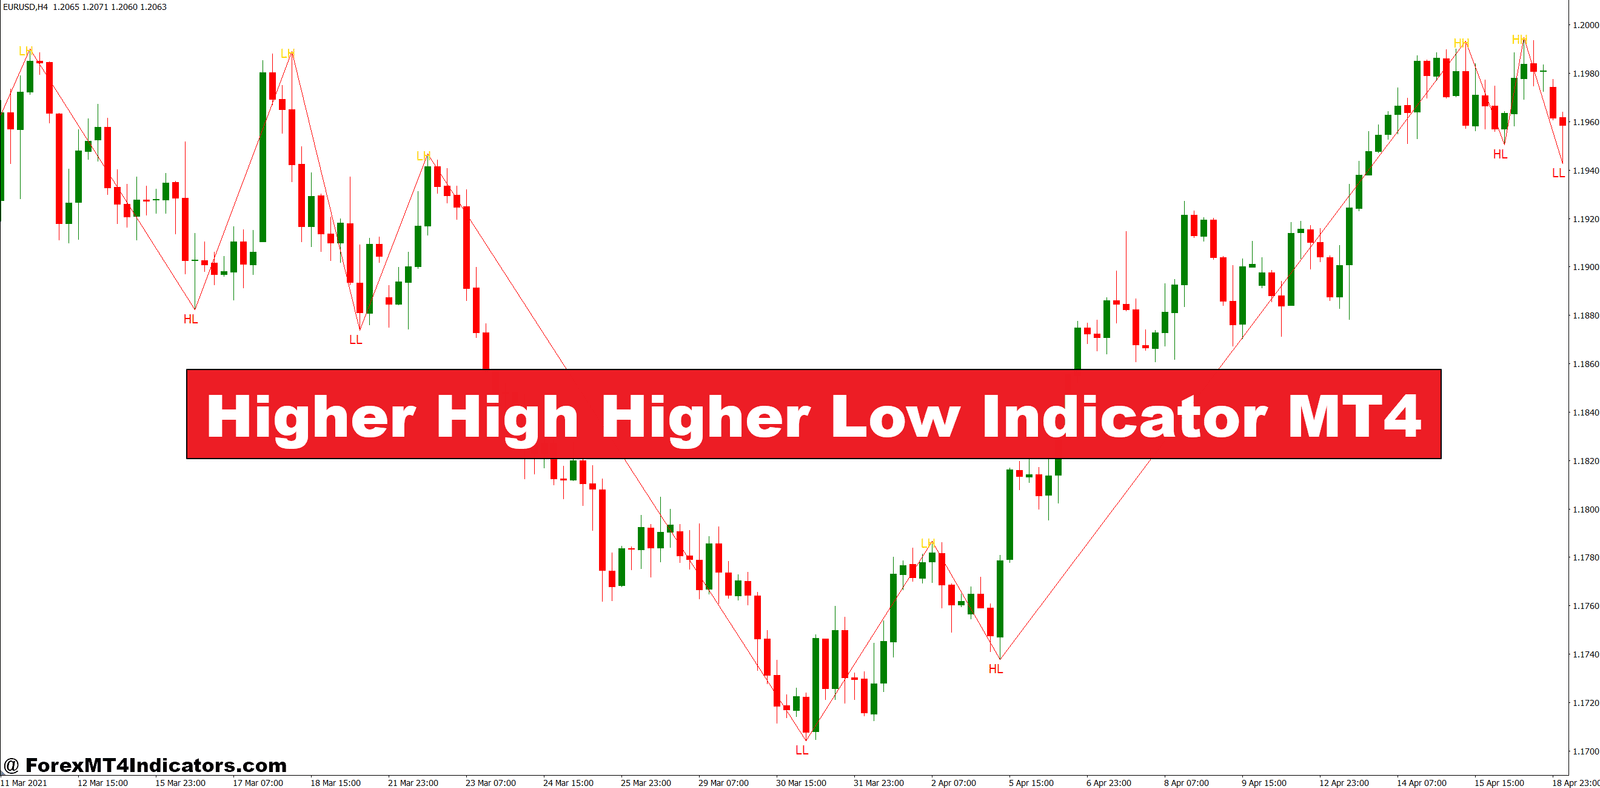
The HHHL indicator is a technical analysis tool that plots swing points on your MT4 chart and labels them based on their relationship to previous swings. When price forms a peak higher than the last peak, it marks it as a “Higher High” (HH). When a trough settles above the previous trough, it identifies a “Higher Low” (HL). The opposite applies for downtrends: Lower Highs (LH) and Lower Lows (LL).
But here’s the thing – this isn’t just about slapping labels on a chart. The indicator reveals market structure in real-time. Traders use this information to gauge trend strength and spot potential reversals. A series of HH and HL suggests buyers are in control. When you start seeing LH or LL formations breaking the pattern, that’s your warning signal that momentum might be shifting.
The calculation relies on swing detection logic. The indicator scans a specified number of bars (usually 5-10) to the left and right of a potential swing point. If that price level exceeds all surrounding bars, it qualifies as a swing high. The same process applies for swing lows, just inverted.
Trading Applications That Actually Work

Let’s get specific. On a GBP/USD 4-hour chart during a trending phase, you might spot three consecutive HL formations with rising HH points. Each pullback to the higher low presents a lower-risk entry opportunity. Traders often place stops below the most recent HL, giving the trade room to breathe while maintaining controlled risk.
The indicator shines during strong trends but struggles in choppy, sideways markets. A trader testing this on USD/JPY during Asian session consolidation would see whipsaw signals – HH quickly followed by LH, then back to HH. That’s not the indicator failing; it’s doing exactly what it should: showing that no clear trend exists.
Real-world example: During the October 2024 EUR/USD rally, the pair carved out seven higher lows over three weeks on the daily chart. Traders who entered near each HL with stops below the previous one captured the bulk of that 400-pip move. The indicator made those entry points crystal clear without subjective interpretation.
For exits, watch for the pattern to break. When price forms a LH after a series of HHs, that’s often the first clue that bulls are losing steam. Aggressive traders might exit; conservative ones wait for the confirming LL.
Customization and Settings

Most versions of this indicator let you adjust the swing detection period. The default is usually 5 bars, meaning the indicator needs 5 bars on each side to confirm a swing. Decrease this to 3 for more sensitive detection on lower timeframes like 15-minute charts. Increase it to 10 or 12 for daily charts to filter out noise.
Color customization helps with visual clarity. Set HH and HL in green shades, LH and LL in red. Some traders prefer arrows pointing up or down; others like text labels. The MT4 version typically offers both.
Alert settings are crucial. Configure pop-up alerts when new swing points form. For swing traders checking charts once or twice daily, email or push notifications make sense. Day traders might skip alerts to avoid distraction.
Timeframe matters significantly. On a 1-hour chart, you’ll see far more swing points than on a daily. Neither is wrong – they serve different trading styles. Scalpers might use 5-15 minute timeframes with low swing detection periods. Position traders stick to daily or weekly with higher periods to avoid false signals.
Advantages and Real Limitations
The indicator excels at removing bias. You can’t argue with a clearly marked higher high – it either is or isn’t. This objectivity helps newer traders avoid common mistakes like calling bottoms too early or holding onto losers hoping for reversal.
It pairs well with other tools. Combine it with moving averages or trendlines, and you’ve got a robust confirmation system. When price makes a HL above the 50 EMA, that’s a stronger signal than the HL alone.
But let’s be honest about the limitations. In ranging markets, this indicator becomes almost useless. You’ll get constant back-and-forth signals that don’t lead anywhere profitable. The indicator also repaints on some versions – meaning a swing point might appear, then disappear when price action develops further. Always check if your version has this issue.
Lag is inherent to swing detection. By the time the indicator confirms a HH, price might be 20-30 pips beyond the actual high. For scalpers, that’s too much slippage. For swing traders capturing 100+ pip moves, it’s acceptable.
The indicator won’t work on extremely low timeframes (1-minute charts) for most currency pairs. The noise-to-signal ratio becomes terrible. Stick to 15-minute charts and higher for reliable signals.
How It Compares to Similar Tools
The classic Zigzag indicator serves a similar purpose but draws connecting lines between swings instead of labeling them. Zigzag often repaints aggressively, which frustrates traders. The HHHL indicator typically offers more stable marking, though not always non-repainting.
Pivot point indicators identify support and resistance but don’t explicitly track the higher high/higher low structure. You’d need to analyze pivot relationships manually – something the HHHL indicator automates.
Compared to price action patterns like flags or pennants, this indicator provides more systematic identification. Pattern recognition requires skill and experience; HHHL gives consistent output that even beginners can interpret.
How to Trade with Higher High Higher Low Indicator MT4
Buy Entry

- Wait for two consecutive HLs – Enter only after the indicator marks a second Higher Low above the first, confirming the uptrend on EUR/USD 4-hour charts with at least 30-40 pips between the two lows.
- Place stop-loss 10-15 pips below the latest HL – This protects against false breakouts while giving the trade breathing room, especially effective on GBP/USD during London session volatility.
- Confirm with price above the 50 EMA – Only take HH/HL signals when price trades above the 50-period moving average on 1-hour or higher timeframes to filter out counter-trend noise.
- Avoid entries during major resistance zones – Skip the signal if the HH forms within 20 pips of a known daily or weekly resistance level where rejections commonly occur.
- Look for 1.5:1 minimum risk-reward ratio – Measure the distance from entry to the previous HH as your target; if it’s less than 1.5x your stop distance, skip the trade.
- Don’t trade HH/HL in ranging markets – If price bounces between the same high and low for 15+ bars on the 4-hour chart, the indicator will give false signals—wait for a clear breakout.
- Enter on the pullback, not the breakout – Wait for price to retrace to the HL zone after forming the HH; entering at the high often results in 20-30 pip drawdowns immediately.
- Check volume confirmation on higher timeframes – On daily charts, ensure the HH forms with stronger volume than the previous high, indicating genuine buying pressure rather than a fake-out.
Sell Entry

- Require two consecutive LHs before entering – Wait for the indicator to mark a second Lower High below the first on USD/JPY 4-hour charts, confirming downtrend structure with 30+ pips separation.
- Set stop-loss 10-15 pips above the recent LH – Protects your capital if the downtrend fails while accounting for typical EUR/USD volatility during NY session.
- Confirm price below the 50 EMA – Only trade LH/LL signals when price remains under the 50-period moving average on 1-hour or daily timeframes to avoid counter-trend traps.
- Skip entries near major support levels – Ignore LL signals within 20 pips of established daily or weekly support where buyers typically defend, causing reversals.
- Target previous LL with 1.5:1 reward minimum – Measure from entry to the last LL; if potential profit is less than 1.5x your stop-loss distance, the setup isn’t worth the risk.
- Avoid choppy Asian session ranges – If GBP/USD shows LH then HH then LH again within 10 bars on 15-minute charts, it’s consolidation—not a trend, and signals will fail.
- Enter on the rally to LH, not the breakdown – Wait for price to bounce up to the Lower High zone after making the LL; selling at the low often means chasing and poor entry prices.
- Watch for divergence with momentum indicators – If price makes a LL but RSI makes a higher low on 4-hour EUR/USD charts, the downtrend is weakening—skip the signal or reduce position size by 50%.
Final Thoughts
The Higher High Higher Low indicator brings structure to trend analysis by automatically tracking swing points that define market direction. Traders gain objective entry signals near higher lows during uptrends and clear exit warnings when the pattern breaks. The tool works best on 4-hour and daily timeframes during established trends, paired with proper risk management and additional confirmation.
That said, no indicator solves every problem. Ranging markets produce unreliable signals, and lag means you won’t catch exact swing points. Trading forex carries substantial risk, and no indicator guarantees profits. Combine this tool with sound risk management, reasonable position sizing, and realistic expectations.
For traders struggling to time entries in trending markets or those who want more objectivity in their swing analysis, this indicator offers practical value. Test it on demo accounts across different pairs and timeframes. Find the settings that match your trading style. The indicator won’t make you rich overnight, but it might help you stop exiting trends too early or fighting the tape when momentum clearly favors one direction.
Recommended MT4/MT5 Broker
XM Broker
- Free $50 To Start Trading Instantly! (Withdraw-able Profit)
- Deposit Bonus up to $5,000
- Unlimited Loyalty Program
- Award Winning Forex Broker
- Additional Exclusive Bonuses Throughout The Year
- Exclusive 90% VIP Cash Rebates for all Trades!


Already an XM client but missing out on cashback? Open New Real Account and Enter this Partner Code: VIP90


